Advanced Filtering Report
CloudCheckr's Advanced Filtering report allows you to query your AWS Detailed Billing Report based on dimensions such as date range, account, region, service, resource tag, resource ID, operation and usage type. This report allows you to set different parameters, see the results, change the parameter, and review the results interactively.
How the Advanced Filtering Report Works
This report is based on the Detailed Billing Report files downloaded from your AWS account. For more information on Detailed Billing, go here.
For this report to work you must first enable detailed billing. To enable the AWS Detailed Billing report, follow the directions here.
CloudCheckr downloads your Detailed Billing Reports from your programmatic S3 bucket, then imports them into a SQL database in a specific format which then allows you to interactively query the data across months and multiple dimensions. CloudCheckr checks every few hours for the files to be updated. If it detects that the files have been updated, it then downloads the new files and updates the results in the database.
When the Detailed Billing Reports are downloaded, they are parsed into a format in which you can review costs, credits, and the net bill in four other reports—Consolidated Billing Summary, Single Day Summary, Single Month Summary, and Historical 12-Month Summary. The results you are viewing in the Advanced Filtering report are looking at costs only, and do not include credits or the net bill (however, credits and net bill are displayed in the other cost reports).
Getting Billing Data Programmatically from AWS
AWS provides multiple ways to get your billing data programmatically. The first way is using CloudWatch data. CloudWatch Bill Monitoring must be enabled within AWS for CloudCheckr to obtain the CloudWatch cost data. For instruction on enabling monitoring within AWS, please go here.
Once you enable Billing Monitoring, you will then be able to see your CloudWatch billing data in four reports (Consolidated Billing Summary, Single Day Summary, Single Month Summary and Historical 12-Month Summary). View CloudWatch data in these reports by selecting CloudWatch in the Source of billing data drop-down list. However, you will not be able to use the Advanced Filtering report with CloudWatch billing data. Using CloudWatch billing data has many weaknesses. It provides nothing but an appropriate net bill that is updated a few times each day. It typically lags behind by a few hours to a few days from your actual usage. And it provides almost no details to filter or analyze. For these reasons, we strongly recommend you enable and use Detailed Billing to monitoring your AWS costs.
The Detailed Billing Reports are extremely fine-grained. They provide details such as:
- The resource ID of each charge
- The time of the charge down to the hour
- Both credits and costs
- Tags linked to each charge
- Region, service name, and account of each charge
- Operation and usage type for each charge
AWS provides you all these details in a CSV file that you would then need to parse and read through. CloudCheckr does that work for you, reading it all and making it easy to query interactively, to mine and understand literally millions of lines of billing records. We often come across a single month billing file that is several GB compressed and millions of lines.
You will also note that your CloudWatch final bill for the month will be a nominal amount less than your Detailed Billing final amounts, because CloudWatch rolls over to start providing the next month's net bill numbers before the final AWS is calculated. The final bill from CloudWatch is your final bill missing the last 2-24 hours of data. Detailed Billing Reports continue to report into the monthly file until the month is completely closed by Amazon.
One final note, CloudWatch data is not complete. It excludes certain fixed charges such as Support, Reserved Instance purchases, etc... Because of this, your CloudWatch numbers in CloudCheckr may not exactly match your Detailed Billing numbers.
Using the Advanced Filtering Report
No cost data will display when you first load your report. You must click the Filter button to load results. If you do not choose any filter options, by default the report will show you the last 14 days of costs for all of your AWS accounts. Use the Start and End date to display a custom data range.
CloudCheckr looks for older Detailed Billing files and if they exist they will be loaded into your account. You will only have Detailed Billing Reports from the month you first enabled Detailed Billing. AWS is not able to provide billing data looking back into months before you enabled it. Using the Start and End date, you can calculate the costs for a range of dates across a few days, months, or even years (depending on how far back your billing data goes.
The Resource ID text box allows you to filter results down to a specific resource such as an S3 Bucket, an EC2 instance, a CloudFront distribution, etc. Currently, you can only filter on one resource at a time. The Cost type option allows you to display Unblended, Blended or List costs. This is especially important if you are using Consolidated Billing. When you set up consolidated billing, you start to recognize discounts that an individual account would not. The unblended cost is what your costs would be for an independent account. Blended costs reflect what the lower costs after discounts are distributed across multiple accounts. When selecting list cost, CloudCheckr will show the costs using the AWS hourly On-Demand prices. These will not include any reserved or bulk-use discounts.
When you select from the Group by option, the results in the chart and in the table at the bottom will be broken out by those groupings.
You can also choose to Group your data by:
- Account: the AWS account(s) where the costs are occurring. If you are using Consolidated Billing within AWS, all linked accounts will display.
- Region: the AWS region(s) where the costs are occurring. Examples: US East (Northern Virginia), West (Oregon), EU (Ireland), etc.
- AWS Service: the AWS service such as EC2, S3, RDS, etc.
In Detailed Billing data transfer, fees are included in the service where the data transfer occurred. CloudWatch treats Data Transfer as its own service.
- Operation: the specific usage within AWS. Such as RunInstances (the operation of an Amazon EC2 instance).
- Usage Type: Specifies operational details, such as CW-Requests for CloudWatch requests.
When you group the data, the report will show the costs from your selection in a stacked graph. If you group by region, for example, the graph will show you the costs for each AWS region overlayed on one another. The Chart drop-down menu allows you to display the report as either a line graph or an area chart. If you utilize resource tags with your AWS deployment, the report can also be filtered by tag. You can select multiple tags for filtering, but note that the report will only display costs for resources that are assigned each tag selected. If you select a tag that is only being used within EC2 and another tag that is only being used within RDS, your report will show no data. You can also choose to exclude the costs from your tags by selecting the Exclude These Tags checkbox when filtering your data. This will keep any costs associated with the tags being excluded from appearing in the report.
Alternatively, if you use the other filter options (account, region, operation, usage type, or AWS service), the report will display costs for each item selected. If you chose to filter by regions EU (Ireland) and US East (North Virginia) and select only EC2 and S3 for services, the report will show you only the total costs for EC2 and S3 within those two regions. If you group the report by region, the graph will display the total costs in the regions. If you group by AWS Service, the graph will display the total costs for each service.
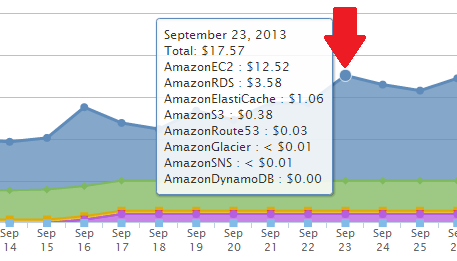
You can hover over any day on the graph to get a list of all the costs for each item that day.
Below the graph you will find the Total, Minimum, Maximum, and Daily Average costs for whatever you've chosen to group by, as well as a breakdown by group.
Saving Filters
CloudCheckr provides you the ability to save any of your filter configurations within the Advanced Filtering report.
To save your filter options, click the Save Filter button. You'll be asked to name your new filter. Once that's done, your filter will be available to be selected from the Saved Filters drop-down menu at the top of the report.When loading a Saved Filter, select it from the drop-down menu. The report will load all of the saved filter options, but will not load the data. This gives you the opportunity to tweak those filter parameters or date range before loading the data. Once you're ready for CloudCheckr to show you your costs, click the Filter button.
Key benefits to using saved filters:
- Your frequently-used filter options will be saved, preventing you from having to remember and click through each option each time you want to retrieve those costs.
- For large or complicated queries, Saved Filters pre-process the data making loading the data in the report very fast. This is particularly important as you reach 10+ million lines in your Detailed Billing Report and need to perform multiple levels of groupings on them.
- All saved filters can be delivered via email on a daily or weekly basis.
Saved filters can be deleted at any time by loading the saved filter, then clicking the Delete Filter button.
Email Filters
The Advanced Filtering report also provides the ability to have any of your saved filters emailed to you on a daily basis.
First, load the saved filter that you would like to receive an email for. When the filter options load, you will see an Email button to the right of the Saved filter drop-down menu.
Click this button. That will display a pop-up asking you to configure a daily and/or monthly email. Enter the email address(es) in the appropriate sections for the emails you would like to receive.
If you selected the daily email, each day you will receive an email from CloudCheckr showing daily and month-to-date costs. The monthly email will provide an end-of-month summary of the costs.
You can disable this email at any time by loading the saved filter and clicking the Manage Emails button. CloudCheckr will display a pop-up showing the addresses assigned to the Daily and Monthly emails. Simply remove the email addresses of the recipients you no longer want to receive the email, or disable the email entirely.
The disabled email can be activated again at any time.
Viewing the Raw AWS Detailed Billing Report
Whether you have the report set to display your data by Day or by Hour, CloudCheckr allows you to download the root AWS Detailed Billing data for that period.
To download this file, simply locate the day or hour on the chart that you would like the root data for and click that point on the graph. CloudCheckr will automatically retrieve that file for you in the form of a CSV spreadsheet.