Inventory Trending Reports: EC2 Instances
The Trending reports on EC2 provide cost and usage over time metrics for the EC2 instances running in your AWS deployment.
To access the trending reports, go to the left navigation pane and choose Inventory > Trending > EC2.
You can choose from four different reports:
History by Time
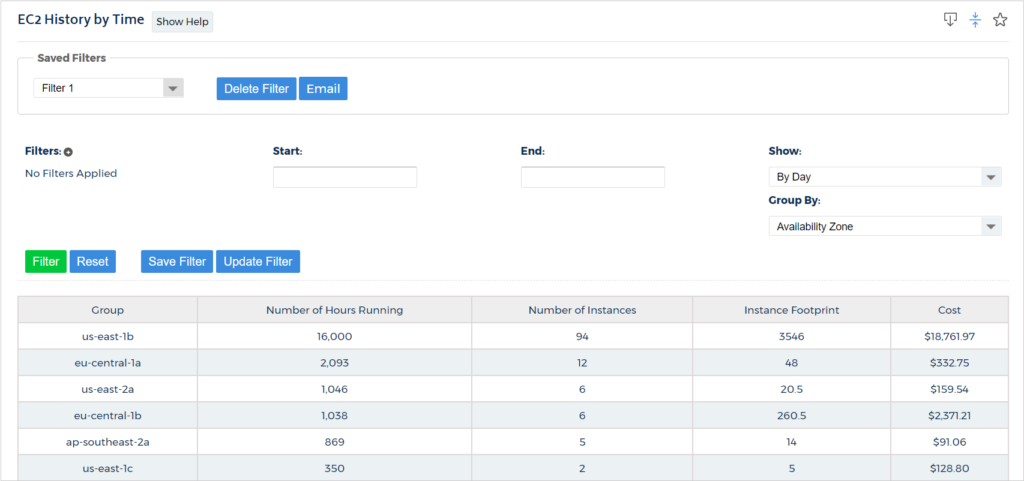
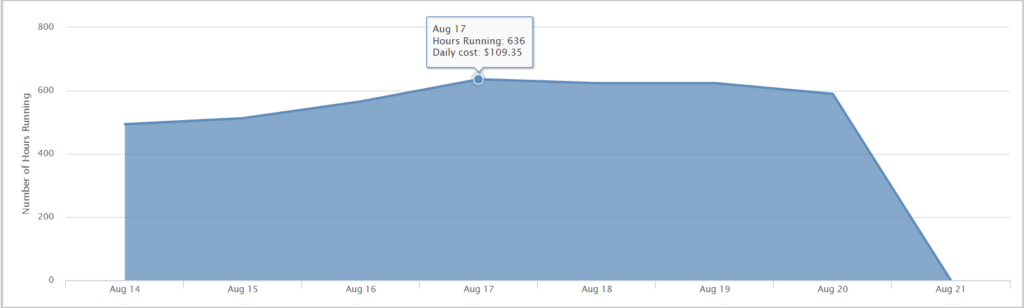
The EC2 History by Time report shows the number of hours run and the billed cost for instances in a given time period.
To access this report, choose Inventory > Trending > EC2 > History by Time.
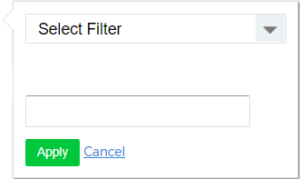 Click the drop-down arrow and select one of the following filters:
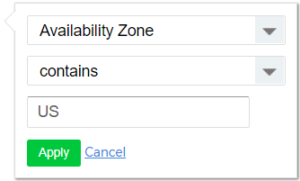
- AMI: the unique Amazon Machine Image used by the EC2 instance
- Availability Zone: the geographical location of the EC2 instance
- AWS Account ID: the 12-digit AWS account ID
- Instance ID: the unique ID for the EC2 instance
- Instance Type (Size): the size of the instance type (EX: t1.micro)
- Platform: the operating system where the EC2 instance is located. (EX: Linux)
- Pricing Type: the type of pricing associated with the EC2 instance
- Tag: the resource tag applied to the EC2 instances (EX: [Key = XXX] [Value = YYY])
- Tenancy: default or dedicated
 You can perform the following actions on filters:
- Delete Filter: remove a saved filter from the report
- Email: configure an email report including who will receive the report and at what frequency
- Filter: generates the report based on the selected parameters
- Reset: returns to the default settings
- Save Filter: save to use this filter for future reports
- Update Filter: saves changes to the existing filter
- Total Number of Hours Running: the total hours that all EC2 instances were running during the selected date range
- Total Number of Instances Running: the total number of EC2 instances that were running at any point during the selected date range.
- Total Cost: the total cost for running the EC2 instances
- Min: the fewest number of hours/instances running for any day/hour during the selected date range
- Max: the highest number of hours/instances running for any day/hour during the selected date range
- Average: the average number of hours/instances running for any day/hour during the selected date range
You can also export the data from the report into a CSV file by clicking ![]() (Save as CSV) button.
(Save as CSV) button.
History by Instance
The EC2 History by Instance report shows the total number of hours running and the total cost for specific instances.To access this report, choose Inventory > Trending > EC2 > History by Instance.
The filters and functionality for this report are the same as the EC2 Instance History by Time report.
You can click on any instance in the list, which will redirect you to the EC2 Instance History by Time report, filtered by that specific instance.
History by Pricing Type
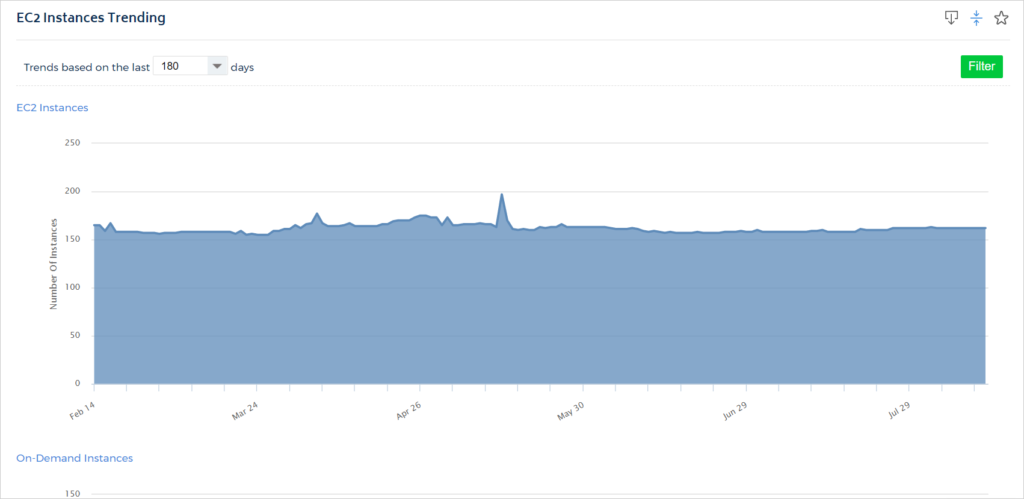
The EC2 Instance History by Pricing Type report shows the trends for each pricing type of EC2 instance (EC2 instance, on-demand EC2 instance, reserved, and spot) based on a selected time period.To access this report, choose Inventory > Trending > EC2 > History by Pricing Type.
Click the Trends based on the last...days drop-down arrow to change the number of days. Options include 7, 30, 90, 180, or 365.
Click Filter to generate a report based on the number of selected days.
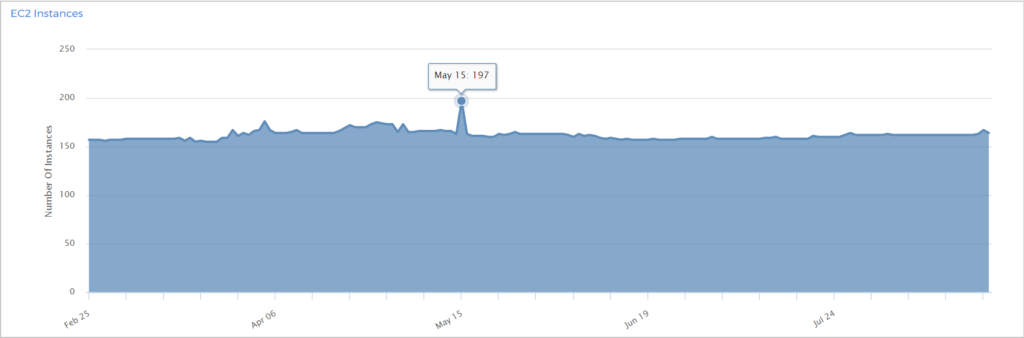
Hover over a point on the graph to see the number of EC2 instances for a selected date.
Other
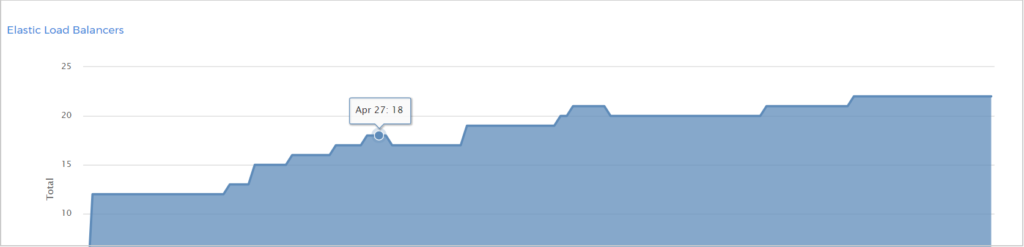
The EC2 Other report shows shows the trends for other data points associated with EC2 instances based on a selected time period. These data points include the following: EBS volumes, EBS volume storage, Elastic Load Balancers, Elastic IPs, Active Reserved Instances, Amazon Machine Images, and EC2 Security Groups.
To access this report, choose Inventory > Trending > EC2 > Other.
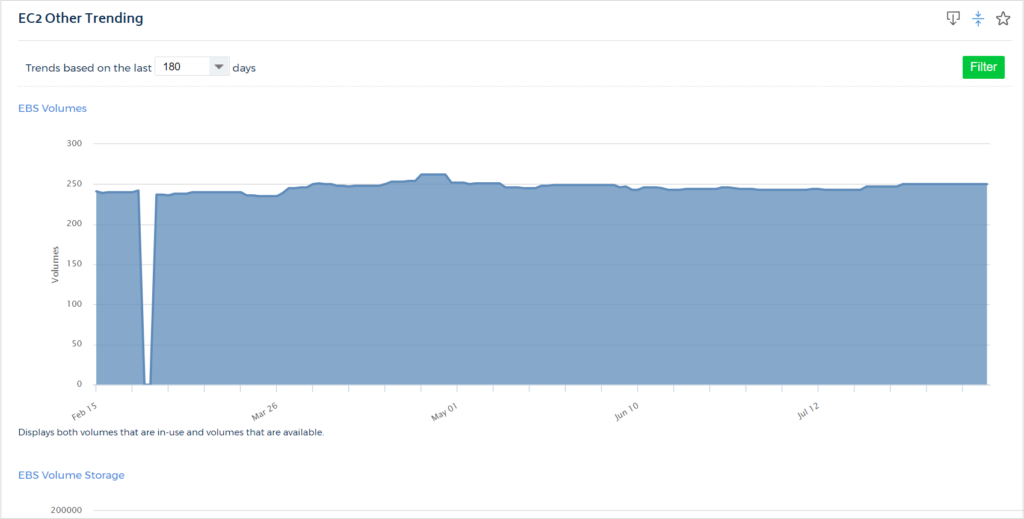
Click the Trends based on the last...days drop-down arrow to change the number of days. Options include 7, 30, 90, 180, or 365.
Click Filter to generate a report based on the number of selected days.
Hover over a point on the graph to see the number for the selected data point on a given day.