Create and Modify Custom Dashboards in CloudCheckr
Dashboards provide quick, distilled views of data related to your cloud cost, security, best practices, inventory, utilization, saved filters, and more. You can choose from more than 30 built-in dashboard panes that you can customize and add to your dashboard view.
This topic will show you how to create and modify your custom dashboards.
Procedures
Click a text box to learn how to create or modify your dashboard:
- Launch CloudCheckr.
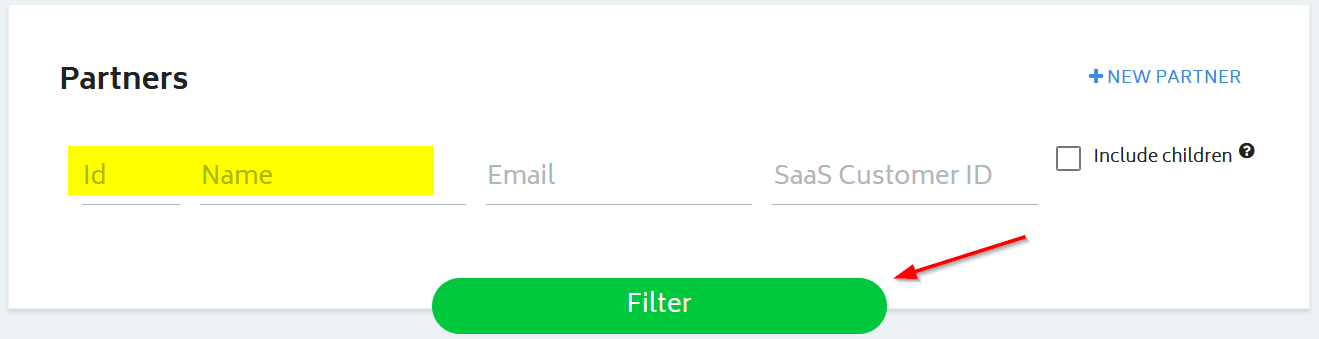
- On the Partners page, search for your project by typing the project name or ID and click Filter.
- Select your project from the list.
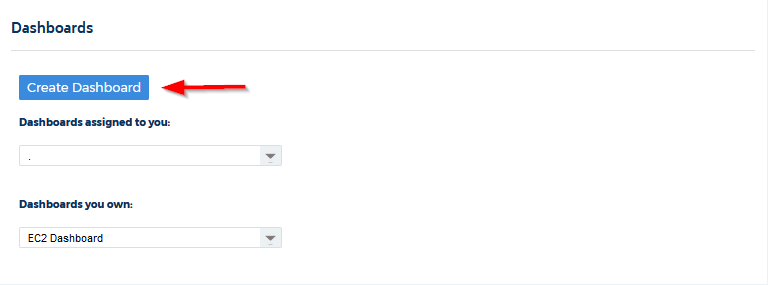
- From header menu, click the Dashboards icon then select Create Dashboard.
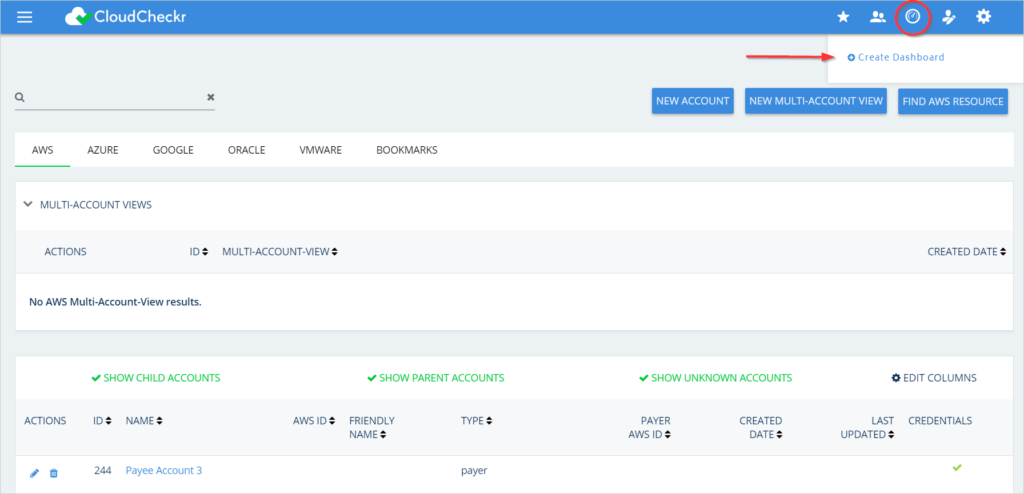
- Click Create Dashboard to display the Create New Dashboard dialog box.
The Create New Dashboard dialog box may have different options depending on your user role.
Here is what the dialog box may look like if you are an admin user:
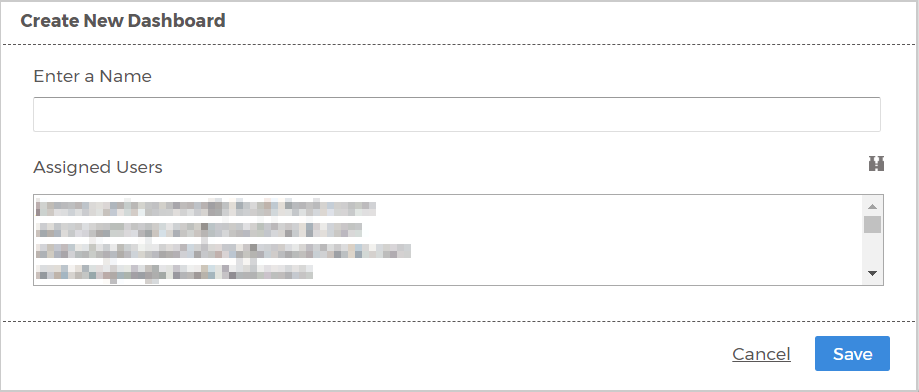
- If you have logged in to CloudCheckr with an admin user role, you can name the dashboard and assign users.
- If you have logged in to CloudCheckr with a basic user role, you can only name the dashboard.
- Perform the following actions in the Create New Dashboard dialog box:
- Type a name for the dashboard.
- From the Assigned Users drop-down list, select the email address of the user or users who will have access to the dashboard.
- Click Save.
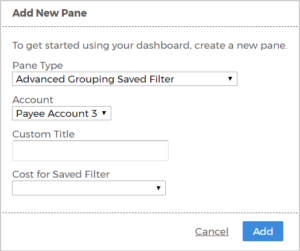
- Perform the following actions in the Add New Pane dialog box:
- From the Pane Type drop-down menu, select one of the built-in panes.
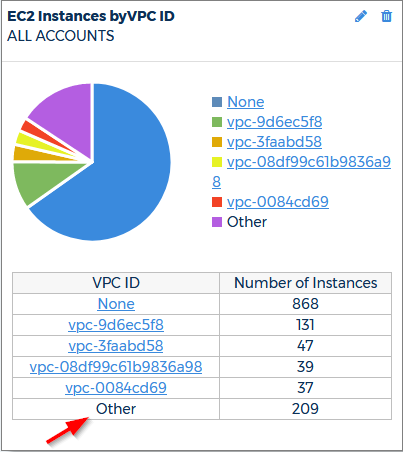
For example, the chief financial officer of ABC Financial may want to have access to the cost data for the company's cloud deployment. You can configure the dashboard to show the built-in panes that show cost-related data.
- From the Account drop-down menu, select the account you want to associate with the dashboard.
- From the Cost for Saved Filter drop-down menu, you can select a saved filter that you created in Advanced Grouping (Cost > AWS Billing > Custom Reporting > Advanced Grouping) or from any saved budget alerts (Cost > Alerts > Manager).
- Click Add.
- From the Pane Type drop-down menu, select one of the built-in panes.
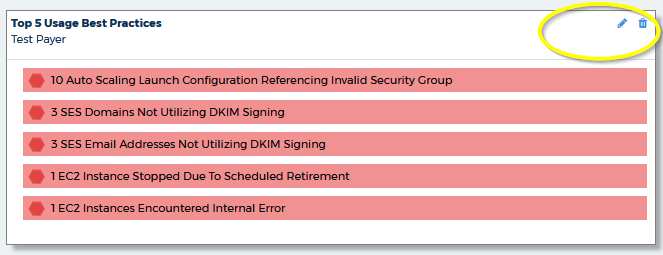
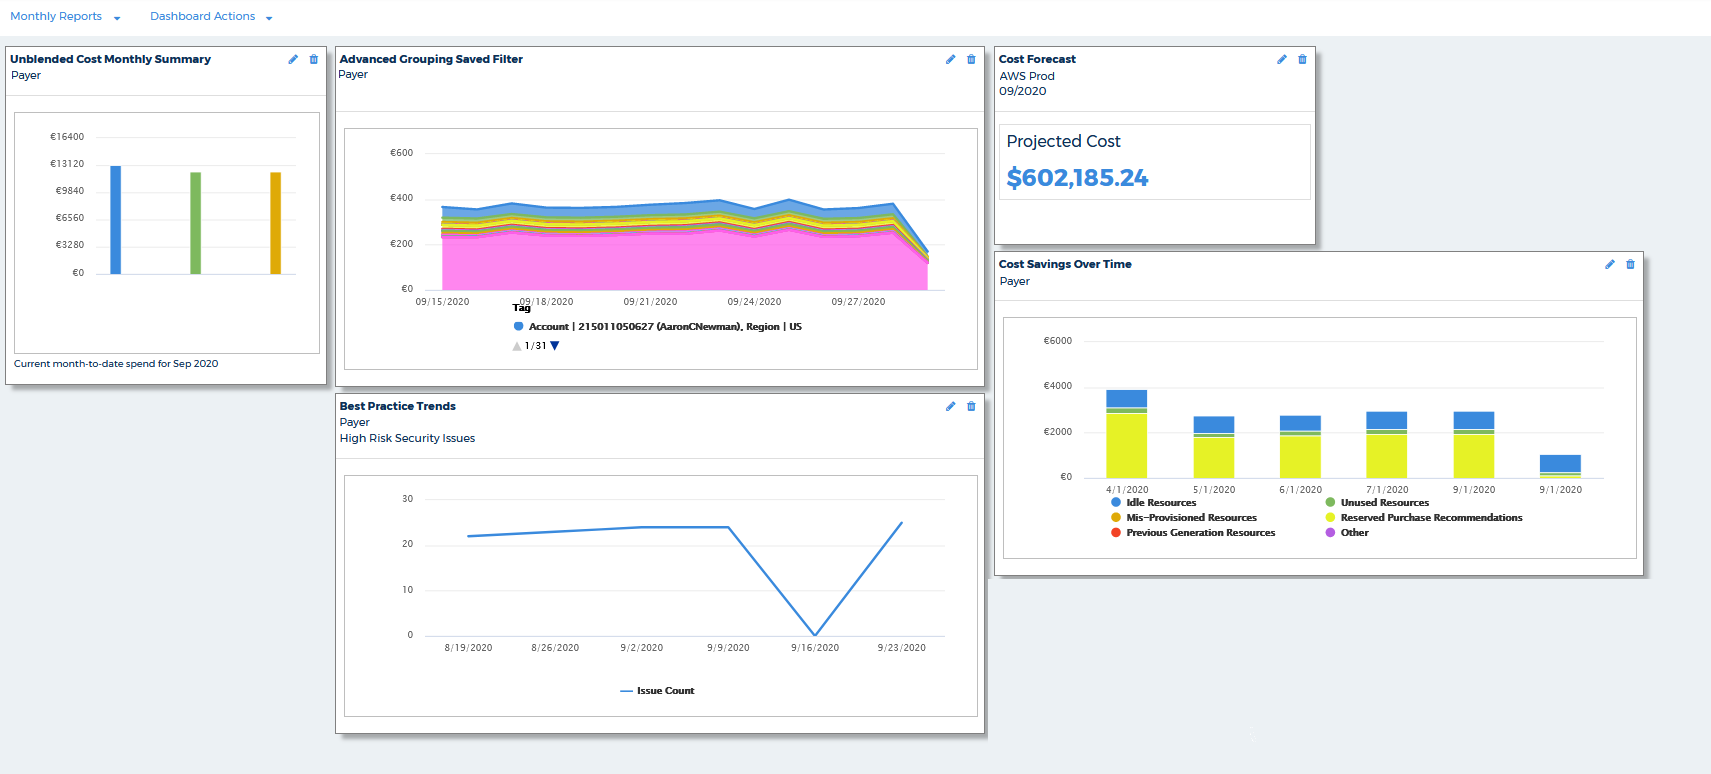
Your completed dashboard will display the name of the dashboard in the upper left corner. All the panes that you added are visible in the dashboard.
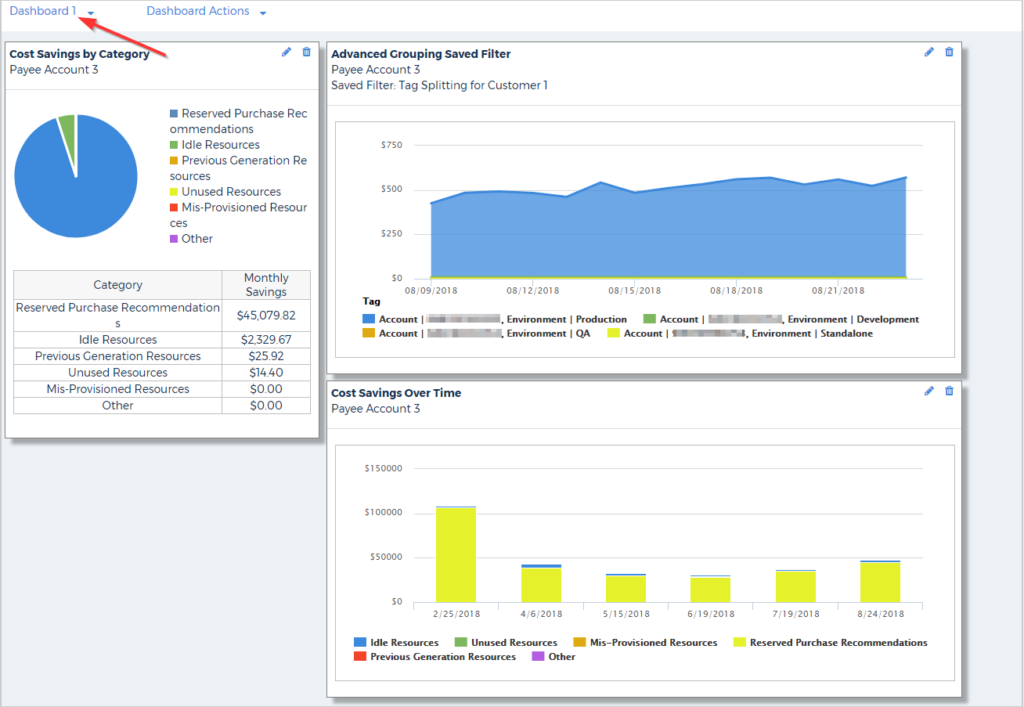
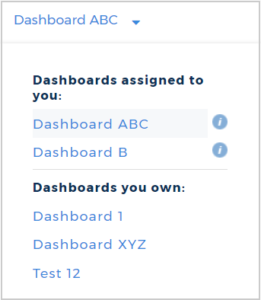
To see a list of the dashboards you own or are assigned to you, click the dashboard name or click the Dashboards icon:
You can also access the Dashboard Actions menu on this page:
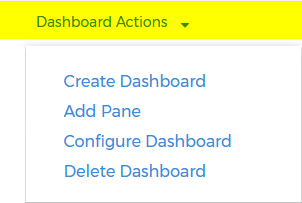
Use the Dashboard Actions to:
- create a new dashboard
- add a pane to the existing dashboard
CloudCheckr does not limit the number of panes that you can add to a dashboard.
- modify the dashboard name by selecting Configure Dashboard
- delete the dashboard
If you have multiple custom dashboards, you can click and drag a pane to rearrange the panes.
You can also modify a pane by clicking  or delete a pane by clicking
 in a selected pane: