Cost View Report
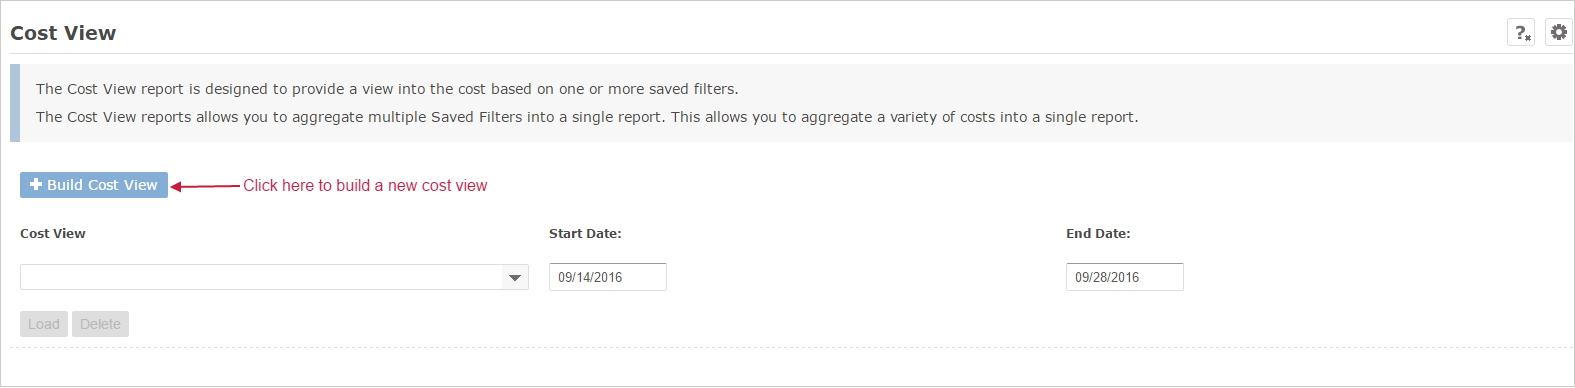
The Cost View Report allows for the aggregation of costs from multiple Saved Filters. This allows a user to effectively build new cost reports which use existing Saved Filters as building blocks for the report. Let's take a look at a basic example where we have two Saved Filters already built in Advanced Grouping. One Saved Filter is named "Asia Pacific Region Costs" and the other is named North America Region Costs. To begin leveraging the power of the Cost View Report you must first build a Cost View. To get started click on the blue button labeled "Build Cost View."
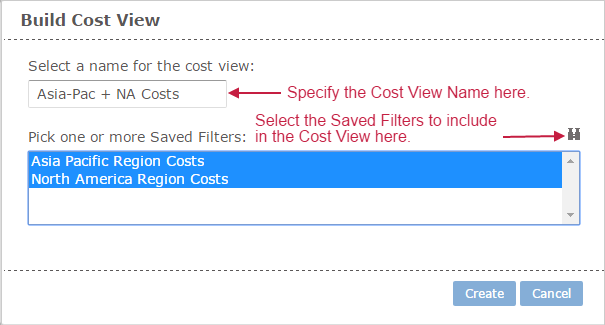
On the next screen, use the multi-select tool to pick which Saved Filters you would like to aggregate in the Cost View.
After the Cost View is built, you can select the Cost View that you would like to load from the pull down menu, and the specify a date range over which to run the report. After selecting the Cost View by it's name and specify the date range, simply click on the load button to load the report. Some Managed Service Providers use Cost View Reports to quickly summarize costs from groups of customers whose invoices are based on Saved Filters, E.g. wholesale customers versus retail customers. Many enterprise customers leverage this report to aggregate costs for multiple Saved Filters built out for specific tags. This allows for ad-hoc reporting when looking to aggregate costs by tags for various cost centers within the organization.