AWS Utilization
CloudCheckr's Utilization reporting helps you keep an eye on your AWS deployment, showing how much your resources are being utilized to help ensure your infrastructure is running smoothly. In the Utilization reports you'll find several different report types across multiple AWS services. The utilization statistics, which are taken from CloudWatch, are saved for the lifetime of your CloudCheckr account. This allows you to view historic utilization trends and makes future planning much easier.
CloudCheckr's Utilization reporting offers the following report types:
Summary
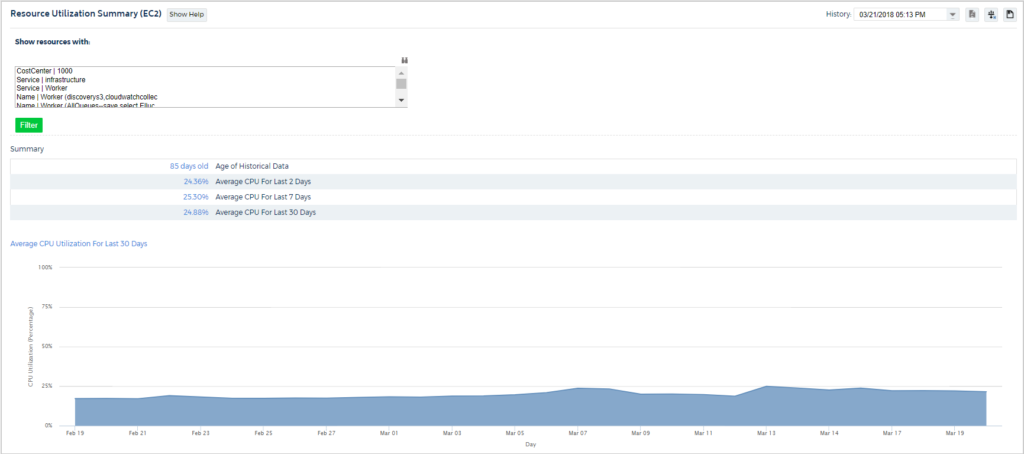
Summary reports take a look across all resources within the selected service and provide important insight into how much those resources are used. The summary reports, which can be broken into different utilization categories (such as CPU and Network), provide key statistics such as the average usage over the past 30 days, usage by day of the week, resource type, and hour of day.
Details
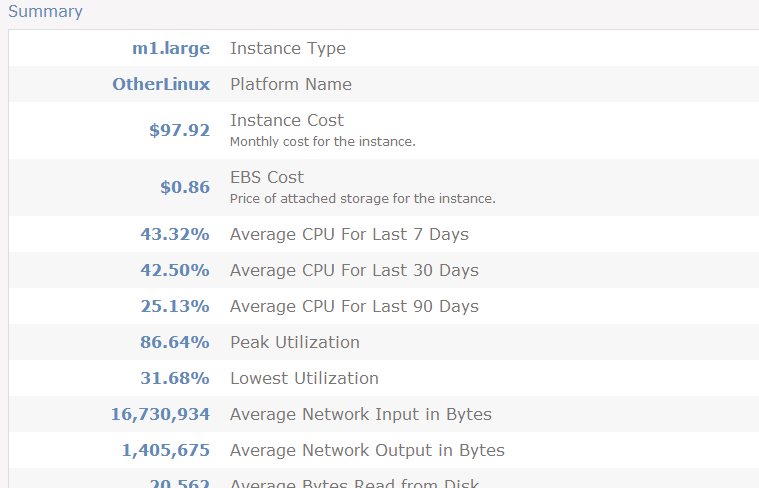
For a full utilization breakdown for each instance CloudCheckr offers Utilization Details reporting. These reports will give you a full list of each of your resources running within the service and offers comprehensive utilization statistics and graphs for reach. Amongst the information these reports provide is a average usage over the past 7, 30, and 90 days, peak and lowest utilization, top 10 hours of highest utilization, and usage by hour of the day, and day of the week.
Heat Maps
Heat Maps provide you with a visual breakdown how heavily your resources were utilized each hour over a 7-day period. You can refresh the report using absolute values (0-100) or relative. There are also several filtering options to look at the data by statistic type (bytes in versus out, for example), resource, or resource tag.
Historical Export
The CloudWatch Historical Export allows you to view and export CloudWatch data to CSV for any user-defined time frame. With this report you can export a complete, hourly list of your CloudWatch metrics into a CSV file. This historic view allows you to spot trends and predict future usage patterns. You can pull the metrics for all resources that ran during the entered time period, or you can filter the data to a specific resource.