CloudTrail Reports
AWS CloudTrail is a web service that records AWS API calls for your account and delivers log files to you. The recorded information includes the identity of the API caller, the time of the API call, the source IP address of the API caller, the request parameters, and the response elements returned by the AWS service.
With CloudTrail, you can get a history of AWS API calls for your account, including API calls made via the AWS Management Console, AWS SDKs, command line tools, and higher-level AWS services (such as AWS CloudFormation). The AWS API call history produced by CloudTrail enables security analysis, resource change tracking, and compliance auditing.
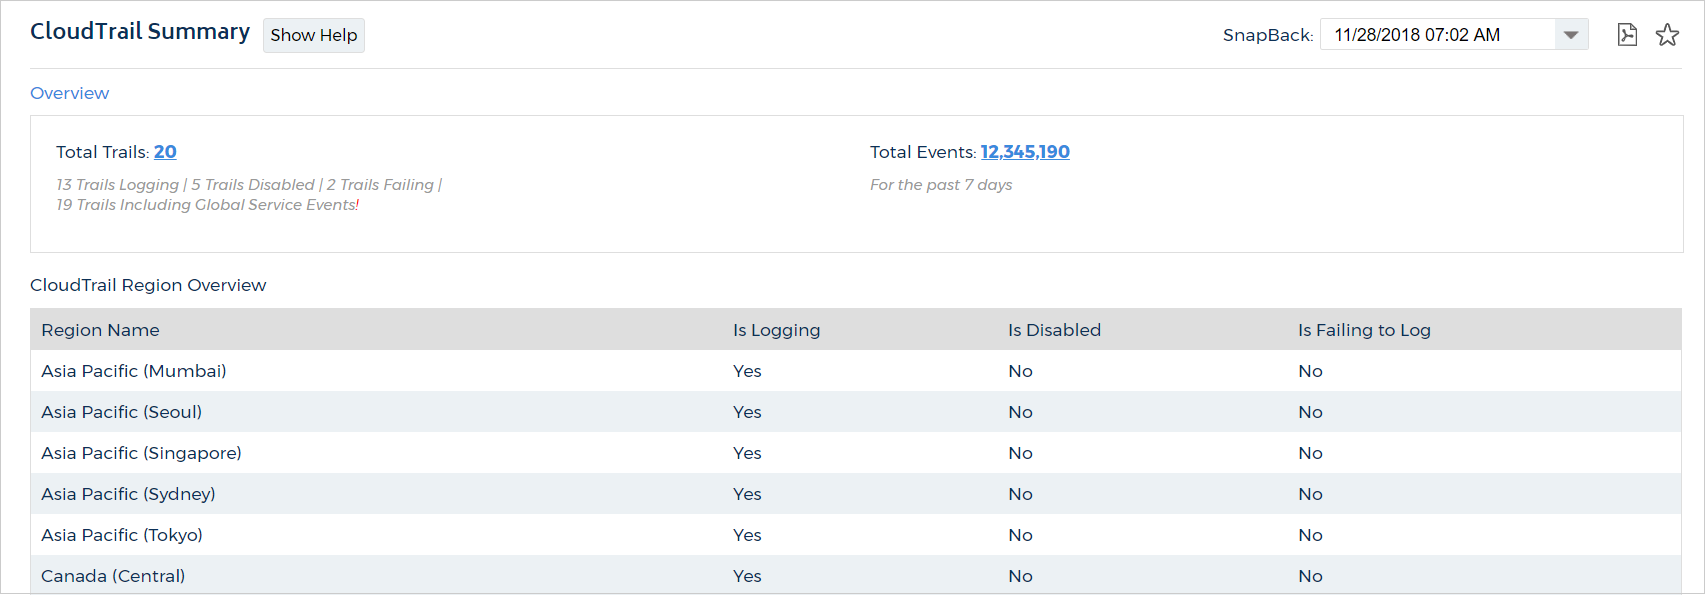
CloudTrail Summary
To access the CloudTrail Summary report, go to the left navigation pane and choose Security > Activity Monitoring > AWS API (CloudTrail) > Summary .
The CloudTrail Summary Report provides high-level statistics about your account activity taken from your CloudTrail logs.
- Total Trails: the number of trails you have enabled across your AWS account
- Total Events: the number of unique events within your AWS account
- Region: the region where trails are being logged
- Events: the total number of interactions with your AWS account from that region
- Service: the AWS service that is being interacted with
- Events: the total number of interactions with that AWS service
- Event Name: the name of the interaction with the AWS
- Count: the total number of events
- User: the IAM username
- Events: the total number of interactions that user had with the AWS account
- IP: the unique IP address associated with the event
- Events: the total number of interactions that IP address had with the AWS account
- Resources: shows the friendly name of the resource who is associated with the AWS activity
- Events: the total number of interactions that resource had with the AWS account
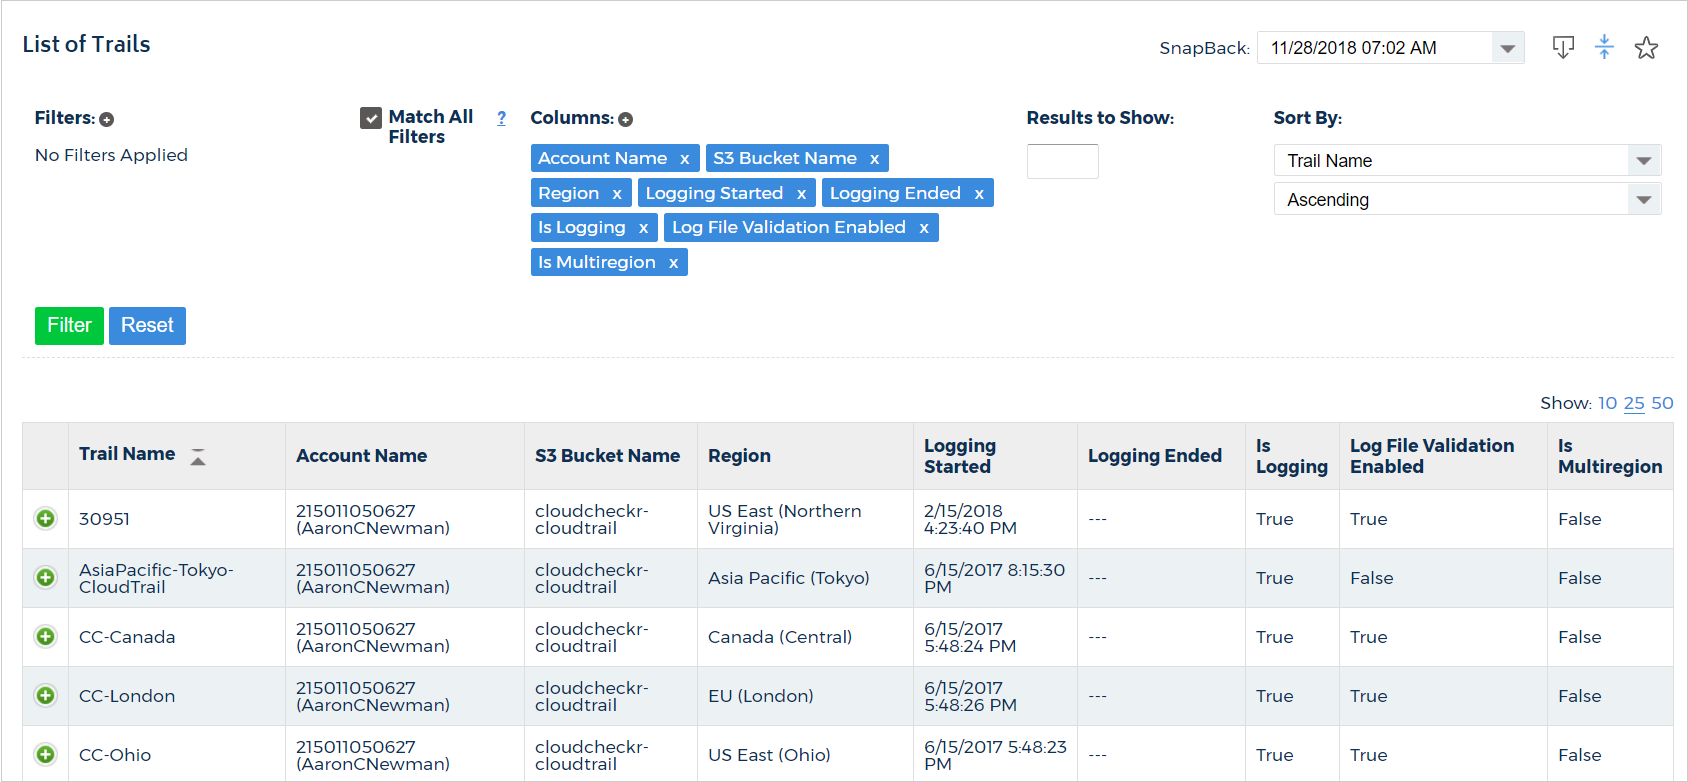
CloudTrail List of Trails
To access the CloudTrail List of Trails report, go to the left navigation pane and choose Security > Activity Monitoring > AWS API (CloudTrail) > List of Trails .
The CloudTrail List of Trails report provides details about your CloudTrail deployment.
- S3 Bucket Name: the name of the S3 bucket where the Trails are being logged
- S3 Key Prefix: the prefix appended to the log files of the trails
- Is Logging: identifies if logging is enabled or not
- Include Global Service Events: indicates if trails are being recorded from services such as IAM or AWS STS that are not region-specific
If you include global services in multiple regions, you will generate duplicate entries for a single event in the log files.
- Logging Started: the most recent date and time when CloudTrail started recording API calls for an AWS account
- Logging Ended: the most recent date and time when CloudTrail stopped recording API calls for an AWS account
- Last Delivery: the date and time that CloudTrail last delivered log files to an account's Amazon S3 bucket
- Last Notification: the date and time of the most recent Amazon SNS notification that CloudTrail has written a new log file to an account's Amazon S3 bucket
- SNS Topic Name: the name of the topic within SNS that CloudTrail notifications are sent through
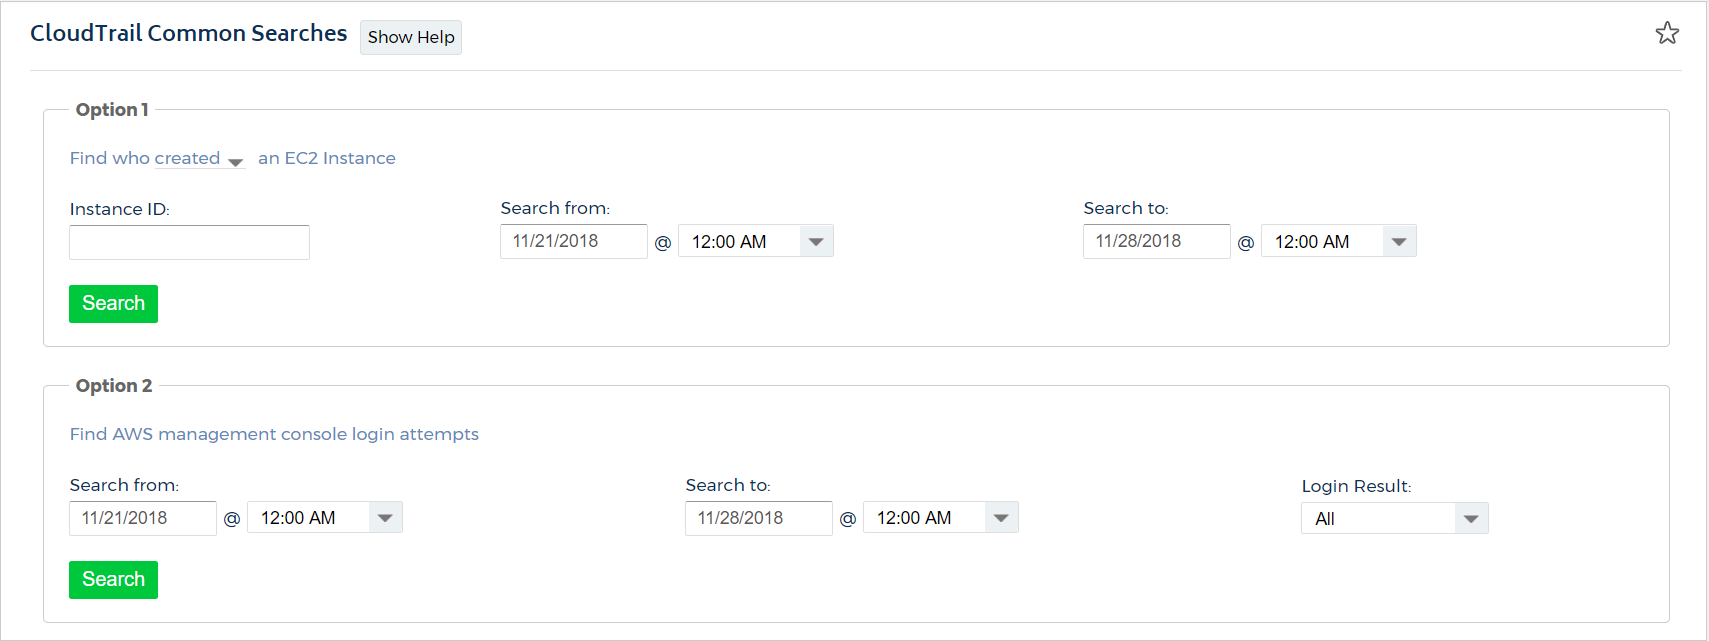
CloudTrail Common Searches
To access the CloudTrail Common Searches report, go to the left navigation pane and choose Security > Activity Monitoring > AWS API (CloudTrail) > Common Searches.
The CloudTrail Common Searches report makes it easy to get to the CloudTrail data you need by presenting you with common filter options.
The statistics for this report are collected from the trails generated from CloudTrail. CloudTrail must be enabled in your AWS account, and access must be given to CloudCheckr to report on this data.
The report is pre-built with search parameters from the most common use-cases for using CloudTrail within CloudCheckr. The report offers four search options. Choose which search you would like to perform, select your desired date range for your search and click the Search button. Once you search, you will be directed to the CloudTrail Events report, filtered down to the specific events that matched your search.
The CloudTrail Common Searches Report contains the following default searches:
Option 1: Find Who Started an EC2 Instance
This search allows you to go back in time and identify which IAM user started a specific EC2 instance.
When using this option, CloudCheckr will find any CloudTrail RunInstance events, for your selected date range, that match your instance ID. You can enter a single EC2 instance ID (ex: i-d13ag3a1) into the Instance ID text box to lookup
the history for a specific instance. Alternately, if you leave the text box empty and search, you will be given a list of ALL the RunInstance events across all of your EC2 instances.
When you perform this search, the CloudTrail Events report will be grouped by User Name, allowing you to view the user(s) that started your instance(s).
Option 2: Find Unauthorized Access Attempts
This search allows you to find any unauthorized access attempts made against your AWS account(s). An unauthorized access attempt is any call made against AWS that was failed with: errorMessage?: Not authorized... This is typically
the result of someone trying to access a resource or service they do not have access for. This search will return all events that failed with the Not authorized... error for your selected date range. When you perform this search, the
CloudTrail Events report will be grouped by user name, filtered to the Error response type, allowing you to view each failed attempt for any user.
Option 3: Find All Activity for a Specific IAM User
This search will allow you to find all the events for any of your IAM users, for whichever date range you'd like. The User list is multi-select, meaning you can select one or more of the users within the list to use for your search. Alternatively, if you click the binoculars icon above the list of user names, you will be given a pop-up that allows you to search for, and select, whichever user you would like to use for your search. When you perform this search, the CloudTrail Events report will be grouped by user name, allowing you to view each event for any user.
Option 4: Find All Activity for a Specific IP Address
This search allows you to find events that originated from specific IP addresses, during the date range you specify. The list of IP addresses is multi-select, meaning you can select one or more of the IPs within the list to use for your search. Alternatively, if you click the binoculars icon above the list of IP addresses, you will be given a pop-up that allows you to search for, and select, whichever IPs you would like to use for your search. When you perform this search, the CloudTrail Events report will be grouped by IP address, allowing you to view each event for your IPs.
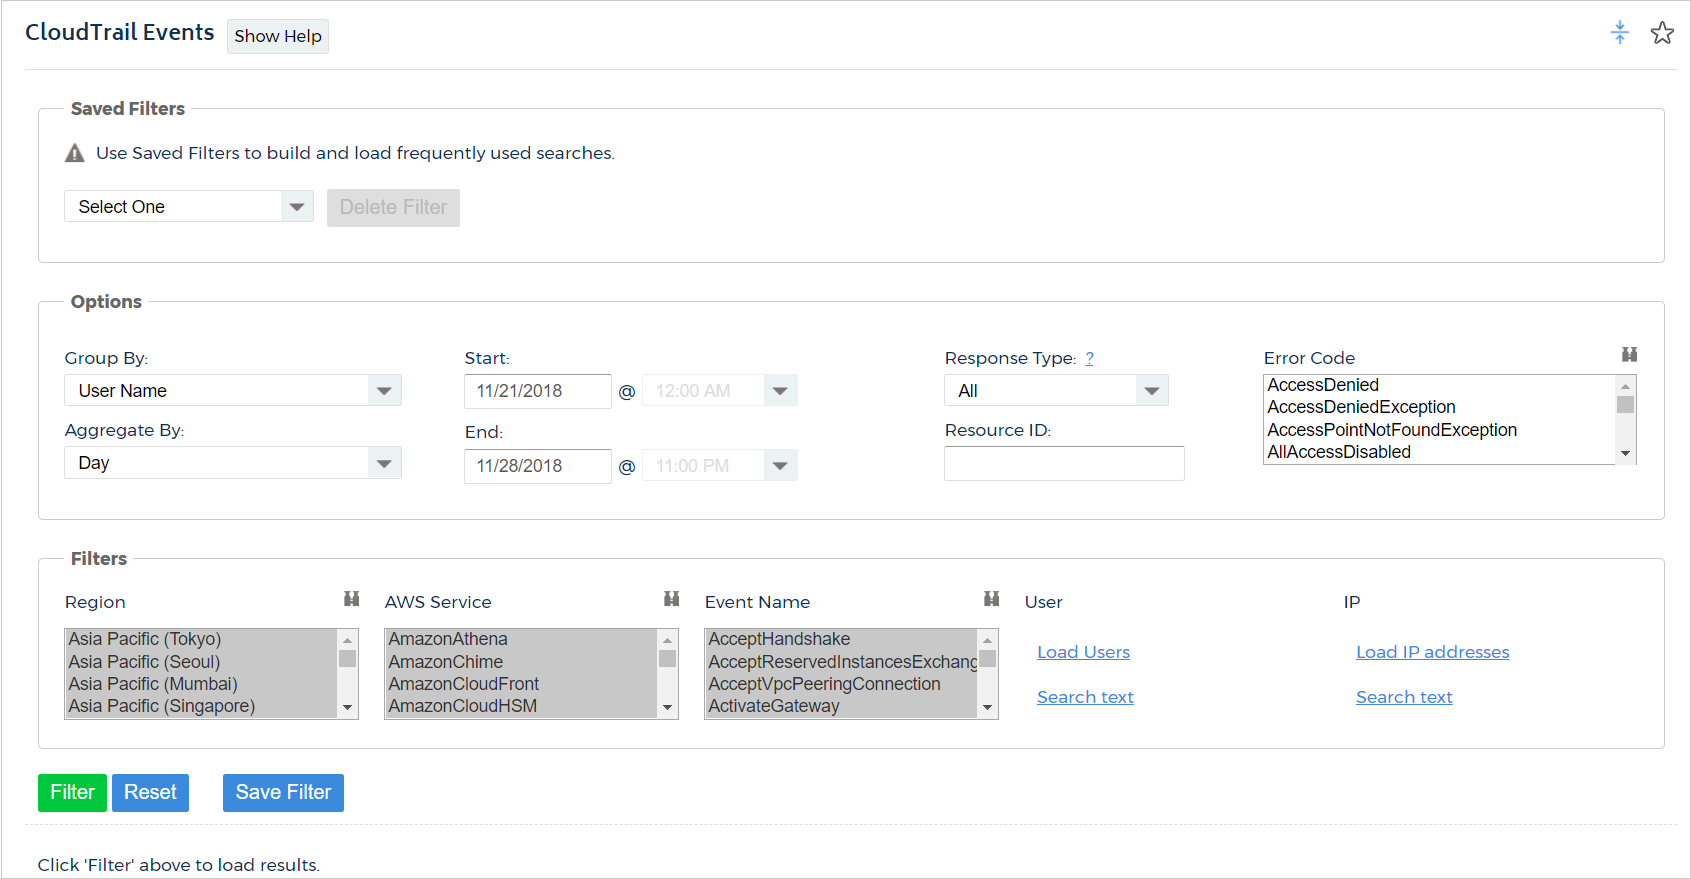
CloudTrail Events
To access the CloudTrail Events report, go to the left navigation pane and choose Security > Activity Monitoring > AWS API (CloudTrail) > Events.
CloudCheckr's CloudTrail Events report provides visibility into the interactions with your AWS account using your trails. The report allows you to group your data by four different categories, view your interactions by day or hour, and filter your events using multiple categories. The statistics for this report are collected from the trails generated from CloudTrail. CloudTrail must be enabled in your AWS account, and access must be given to CloudCheckr to report on this data.
By default, when you first load the report, you will be presented with the last two weeks of events, grouped by user name. Using the many options and filters available in the report, you can change the data to obtain the information you need. Use the Start and End date to display a custom data range. Just note that you can only view data over time frames where CloudTrail was enabled.
Group By
Use the Group By drop-down menu to choose how to organize and display your events.
You can group by the following items:
- User Name: the IAM user name of the person who was interacting with your AWS account
- Event Type: the type of interaction that occurred
Examples: Create Security Group, Terminate Instance, Modify DB Instance - IP Address: the IP Address where the interactions originated from
- Service: the AWS Service that was interacted with
Examples: EC2, S3, RDS
The Aggregate drop-down menu allows you to display the costs by Day or by Hour on the graph. The Resource ID text box allows you to view the events for a specific resource such as an S3 bucket, an EC2 instance, a CloudFront distribution, etc. Currently, you can only filter on one resource at a time. You can also choose to display all events, or just those that were successful or ended with an error.
Filters
Once you've chosen the data you want to display, you can use the one of the following filters to report on the events you'd like:Once you've chosen the data you want to display, you can use the one of the following filters to report on the events you'd like:
- Region: the AWS region(s) where the interactions occurred
CloudTrail is currently only available in US East and US West (Oregon).
- AWS Service: the AWS Service that was interacted with
Examples: EC2, S3, RDS - Event Type: the type of interaction that occurred
Examples: Create Security Group, Terminate Instance, Modify DB Instance - User: the IAM user name of the person who was interacting with your AWS account
- IP: the IP Address where the interactions originated from
When using these additional filter options the report will display events for each item selected. If you chose to filter by US East (North Virginia) region and select only EC2 and S3 for services, the report will only show events that occurred in EC2 and S3 within that region. Click the Filter button to refresh the report with your selections.
Create Report
Once you click Filter, the report will create a chart showing the event that match your options and filter selections, overlayed on one another for whatever date range was selected. You can hover your mouse pointer over any point in the graph to get further details.
Beneath the chart you will see the total number of events, grouped by your selection, over your selected time period.
The column on the right will be show details based on your grouping choice. If you grouped by user, it will list each user. If you grouped by service, it will show the AWS service. The column on the right is the total number of events that occurred within the selected time frame for that user/service, etc. You can then expand on any item by clicking on the green plus icon. This will show further details about all of the events that occurred.
Describe*, List*, and Get*. If you would like to see full details of these read-only events, contact suport@cloudcheckr.com.When looking at the full details of an event, you'll see:
- User: the IAM user name of the person who was interacting with your AWS account
- IP Address: the IP address where the interactions originated from
- Event Name: the type of interaction that occurred
Examples: Create Security Group, Terminate Instance, Modify DB Instance - Service: the AWS Service that was interacted with
Examples: EC2, S3, RDS - Time: the date and time that the event occurred
- Region: the AWS region(s) where the interactions occurred
- Resource ID: the resource ID from the event
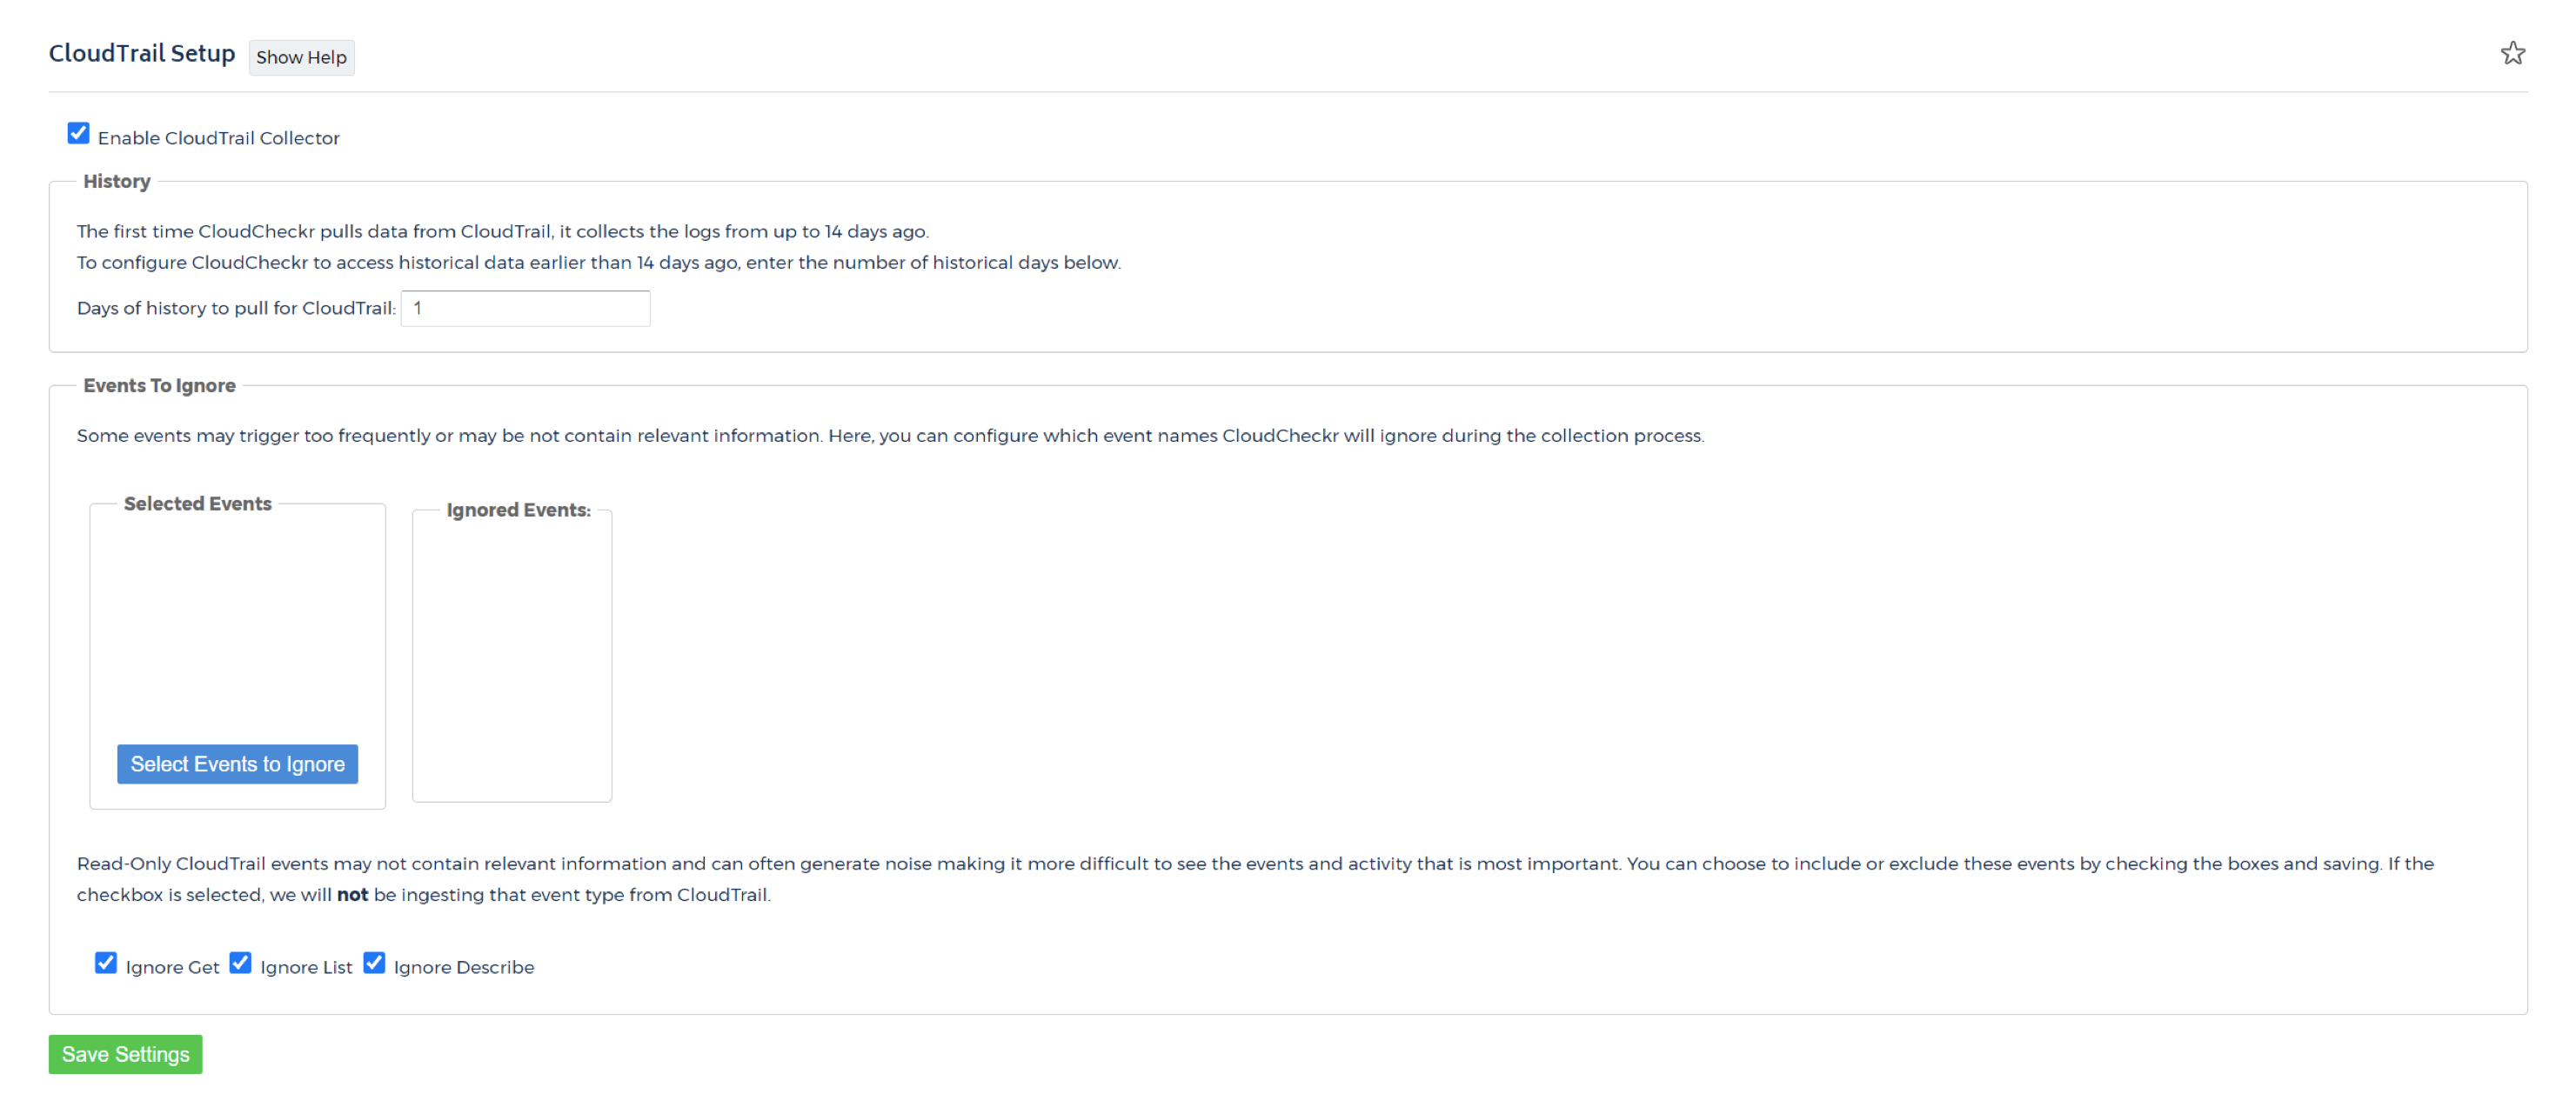
CloudTrail Setup
To access the CloudTrail Setup page, go to the left navigation pane and choose Security > Activity Monitoring > AWS API (CloudTrail) > Setup.
The statistics for all of CloudCheckr's CloudTrail reports are collected from the trails generated from CloudTrail. CloudTrail must be enabled in your AWS account, and access must be given to CloudCheckr to report on this data.
When you create an account with CloudTrail access within CloudCheckr, by default, it will grab the events from the previous 14 days. Then, periodically throughout each day it will grab any new events that were written to your AWS account. If for any reason, you need to view CloudTrail events from any day prior to those initial 14 days CloudCheckr provides that ability. Simply enter the number of days in the past (starting with today) that you would like to retrieve your log files.