If you have a valid API key and Application ID, you can integrate CloudCheckr CMx with Datadog—a cloud-based service that allows you to monitor servers, databases, and more using its data analytics platform. The integration enables you to pull the Memory metrics required for CloudCheckr CMx to build the EC2 Right Sizing report.
This topic will show you how to generate the API key and Application ID in Datadog and complete the integration in CloudCheckr CMx.
Workflow
Follow the steps in this workflow to complete your integration:
In your Datadog account:
Step 1: Generate the API Key and Application ID
In your Datadog account:
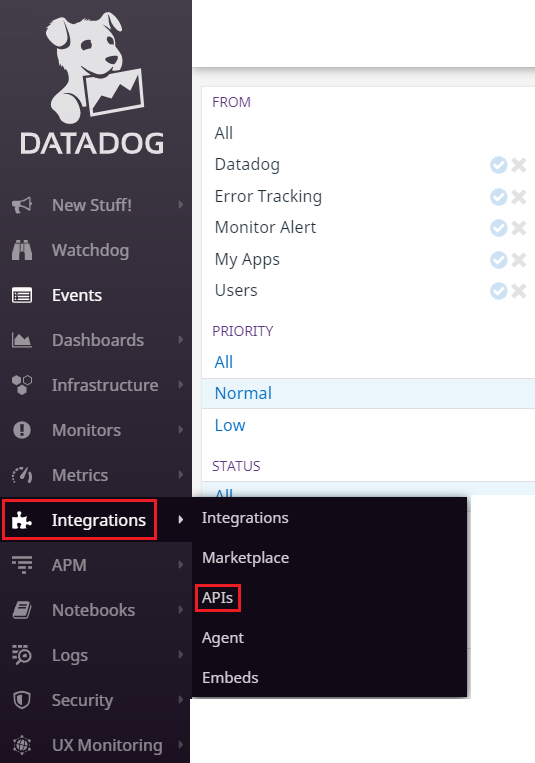
From the left navigation pane, choose Integrations > APIs.
Note that in Datadog, API Keys and Application IDs have moved to the Organization Settings page.
In the API Keys section:
add a new API key and name it CloudCheckr.
once Datadog creates the key, click Copy Key. You will want to take the value with no dashes
copy this API key to a text editor like Microsoft Windows Notepad. CloudCheckr CMx requires this information as part of its integration with Datadog.
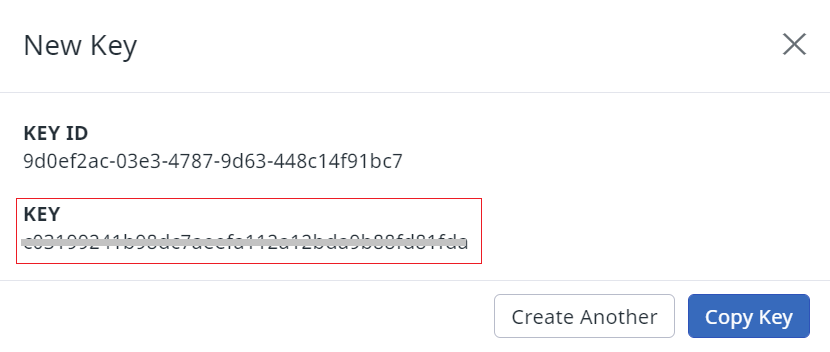
Navigate to Application Keys.
Click + New Key.
Type a name for the application. We recommend that you name it CloudCheckr.
Copy the Key to your text editor. The key will not have any dashes.
In CloudCheckr CMx:
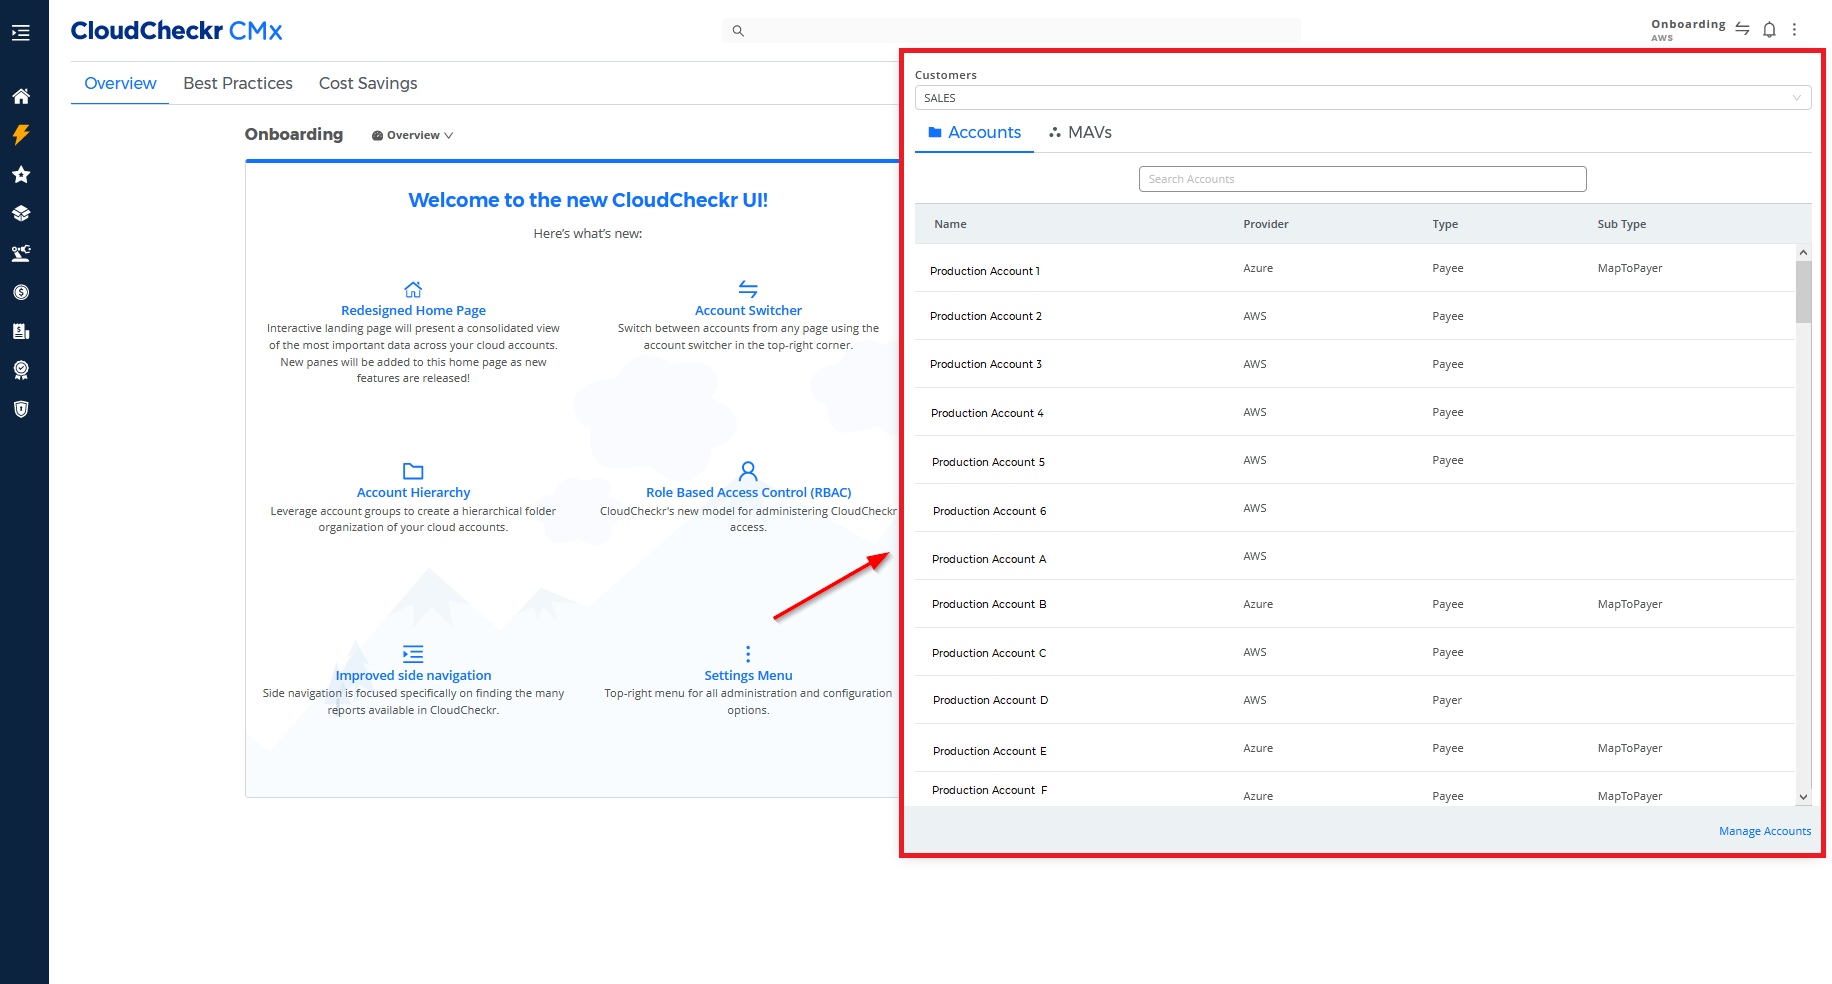
In the Header bar, click . A modal window opens.
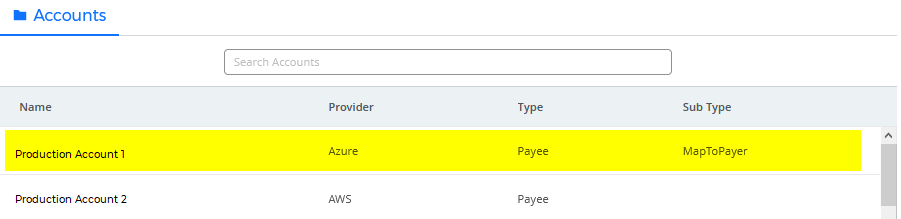
In the Accounts tab, click a row to drill into the selected account.
The modal window closes.
Click the Settings icon and select Account Configuration > Integrations > Datadog .
If you are using our legacy CloudCheckr application, go to the left navigation pane and choose Account Settings > Integrations > Imports > Datadog.
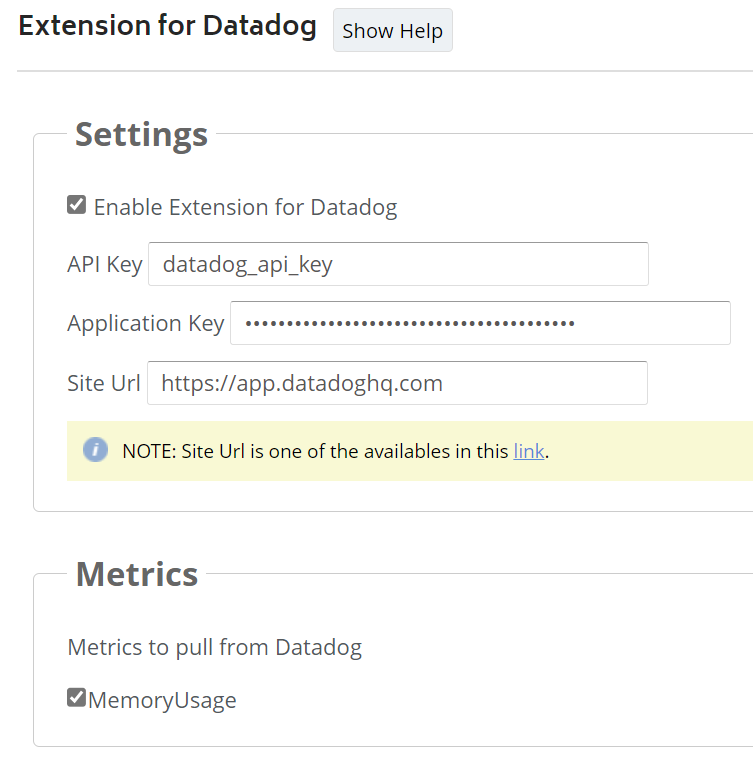
Configure the following:
In the Settings section, paste your API key and Application ID into the appropriate fields.
Enter the Site URL that you use to access Datadog. You can use this guide to determine your Site URL.
In the Metrics section, verify that the MemoryUsage checkbox is selected.
Click Save Settings.
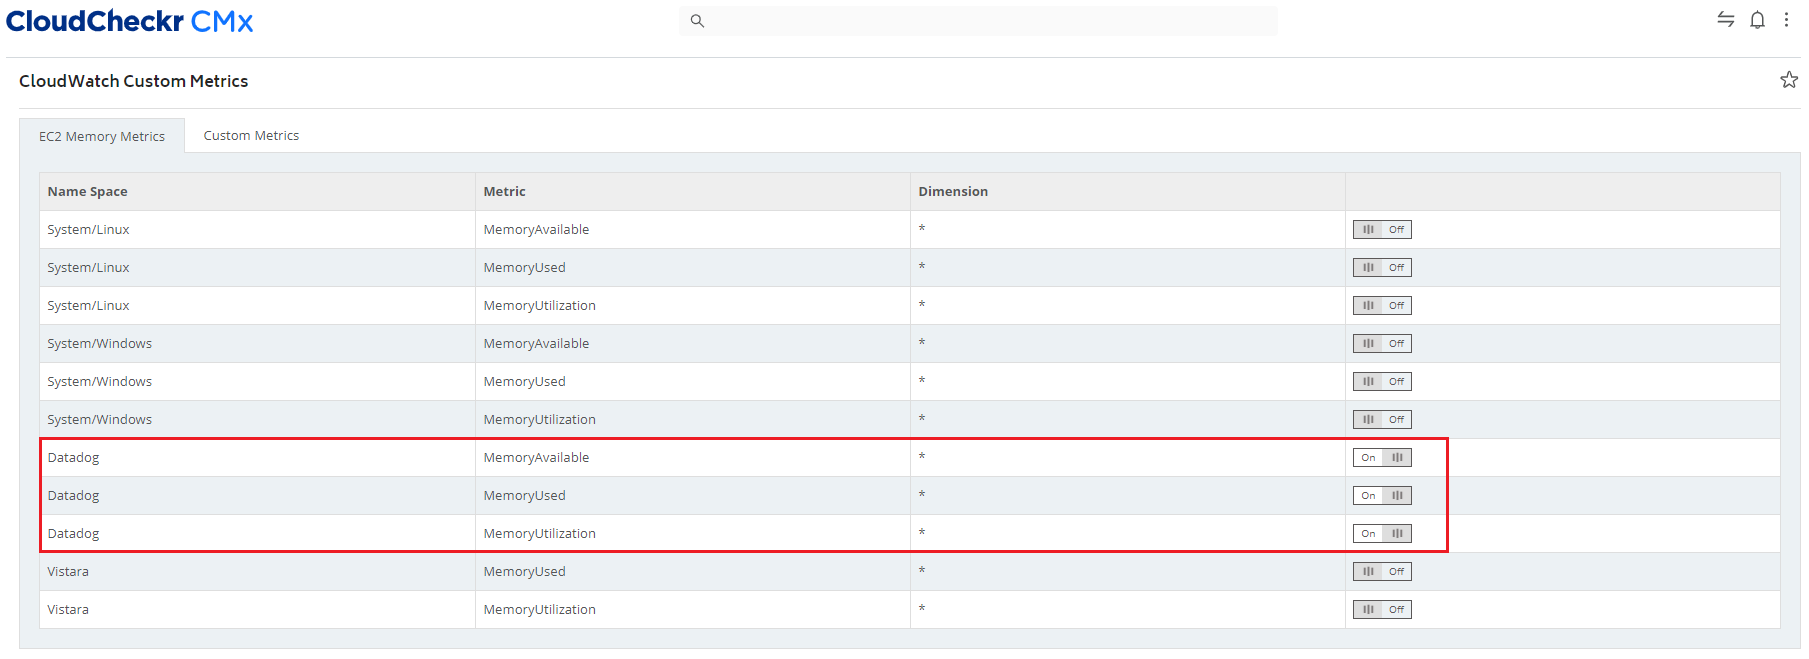
From the left navigation page, choose Resources > Manage Custom Metrics.
If you are using our legacy CloudCheckr application, go to the left navigation pane and choose Utilization > Manage Custom Metrics.
On the CloudWatch Custom Metrics page, toggle the button to On to enable the MemoryAvailable, MemoryUsed, and MemoryUtilization metrics for DataDog.
Once you have completed the integration, it will take a few days before CloudCheckr CMx can leverage the Datadog metrics to populate in the EC2 Right Sizing report.
 Note that in Datadog, API Keys and Application IDs have moved to the Organization Settings page.
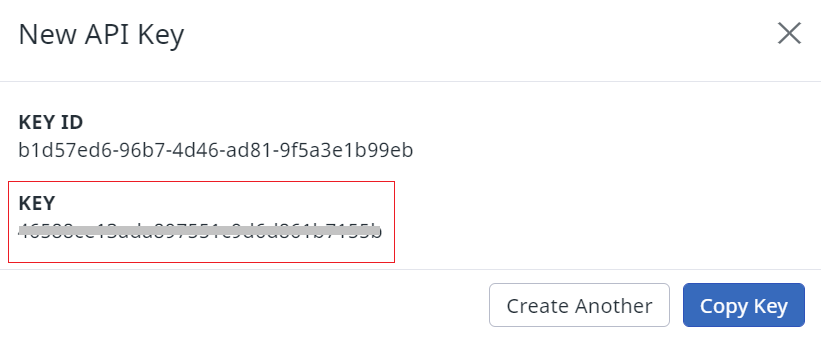
 .
.