How to Set Up a CloudWatch Agent
Amazon CloudWatch monitors your Amazon Web Services (AWS) resources and the applications you run on AWS in real time. You can use CloudWatch to collect and track metrics, which are variables you can measure for your resources and applications.
With CloudWatch, you gain system-wide visibility into resource utilization, application performance, and operational health.
More importantly, CloudCheckr can ingest all these CloudWatch metrics and store them for you for the life of your account—maintaining a searchable record of all your CloudWatch metrics.
Workflow
To allow CloudCheckr to report on the CloudWatch metrics, review and follow this workflow.
In this procedure, we will show you how to launch the EC2 instance that has the AWS Systems Manager Agent (SSM Agent)—the software that updates, manages, and configures EC2 resources:
- Log in to the AWS Management Console.
- From the AWS services page, choose Compute > EC2.
- From the EC2 Dashboard, select Images > AMI.
- Click the drop-down arrow next to Owned by me and select Public images.
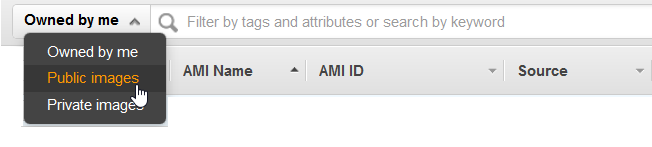
- Select an EC2 instance that has SSM Agent.
In this example, we chose an EC2 instance that has the SSM Agent and uses the Microsoft Windows Server 2012 version:
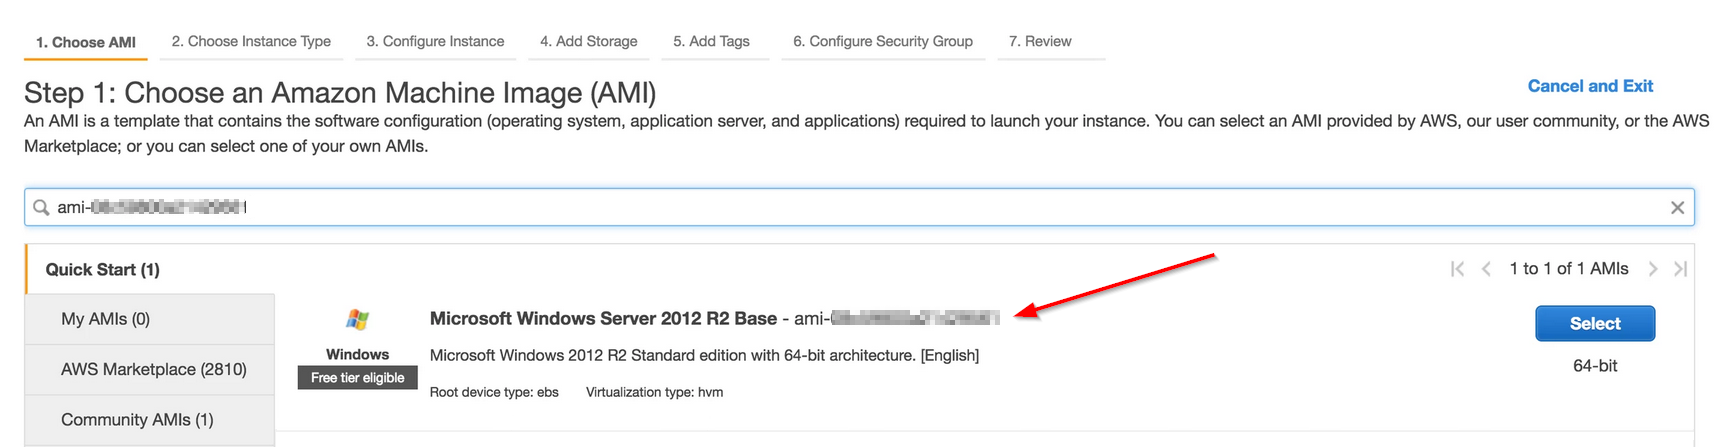 Most new AMIs have the SSM Agent by default. If you are not sure if a publicly available AMI has SSM, contact AWS Support.
In this procedure, you will create an IAM role and attach two IAM policies to it.
- From the AWS services page, choose Security, Identity, & Compliance > IAM.
- From the IAM dashboard, select Roles.
- Click Create role.
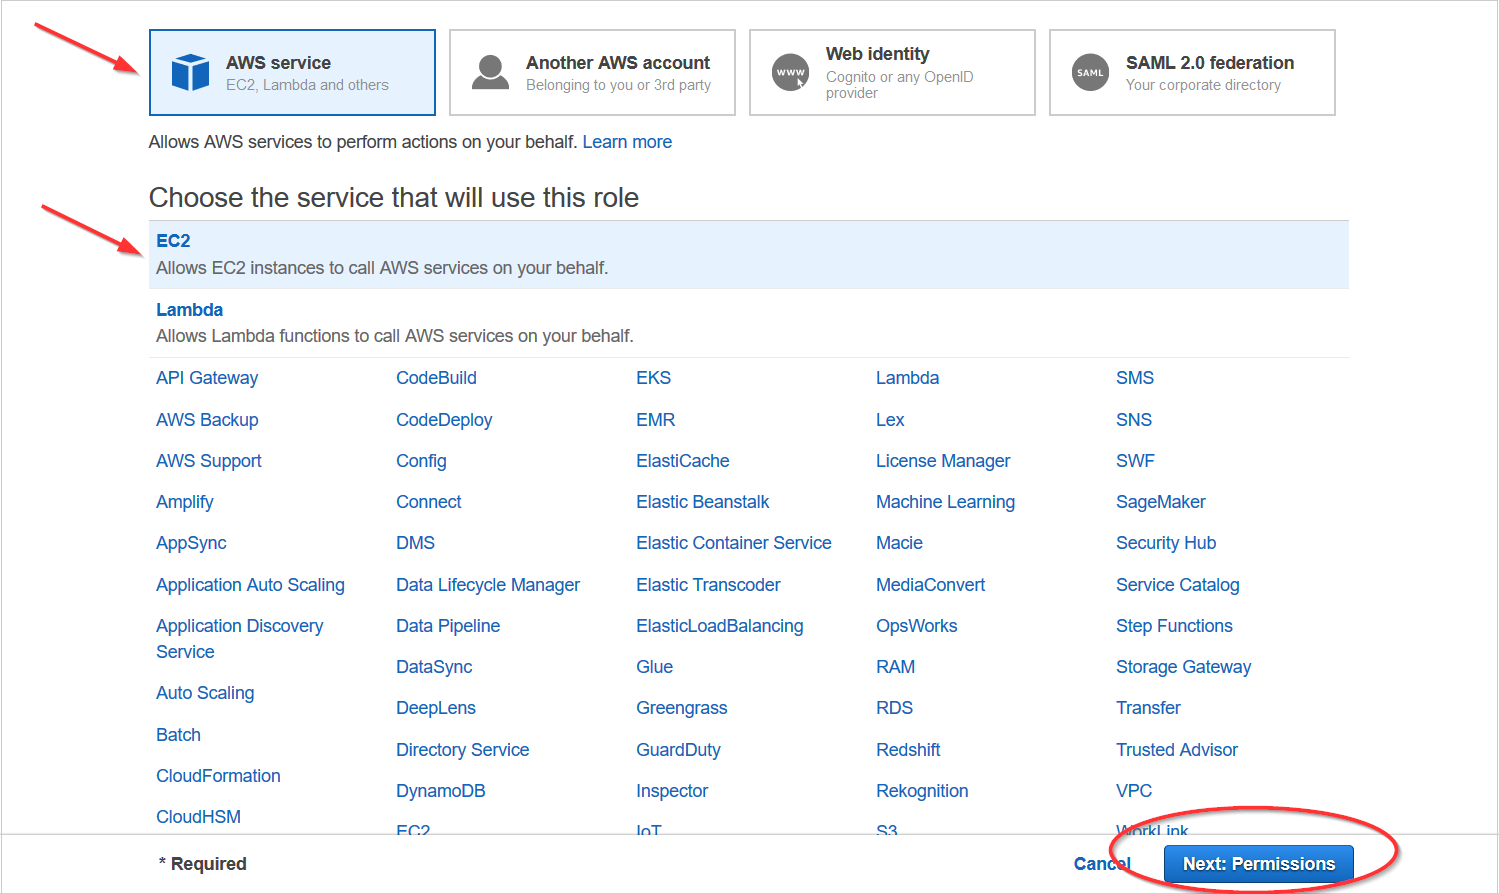
- Select AWS service, choose EC2, and click Next: Permissions.
- Select your first policy:
- If this is your first time and you need to put an agent configuration file in the Parameter Store, select CloudWatchAgentAdminPolicy.
- If you saved an agent configuration file in the Parameter Store, select CloudWatchAgentServerPolicy.
- Select your second policy, AmazonEC2RoleforSSM, which will allow the AWS Systems Manager service to install the CloudWatch Agent on your EC2 instance.
- Click Next: Tags.
- Click Next: Review.
- Type a name for the role, make sure that the two correct policies are attached, and click Create role.
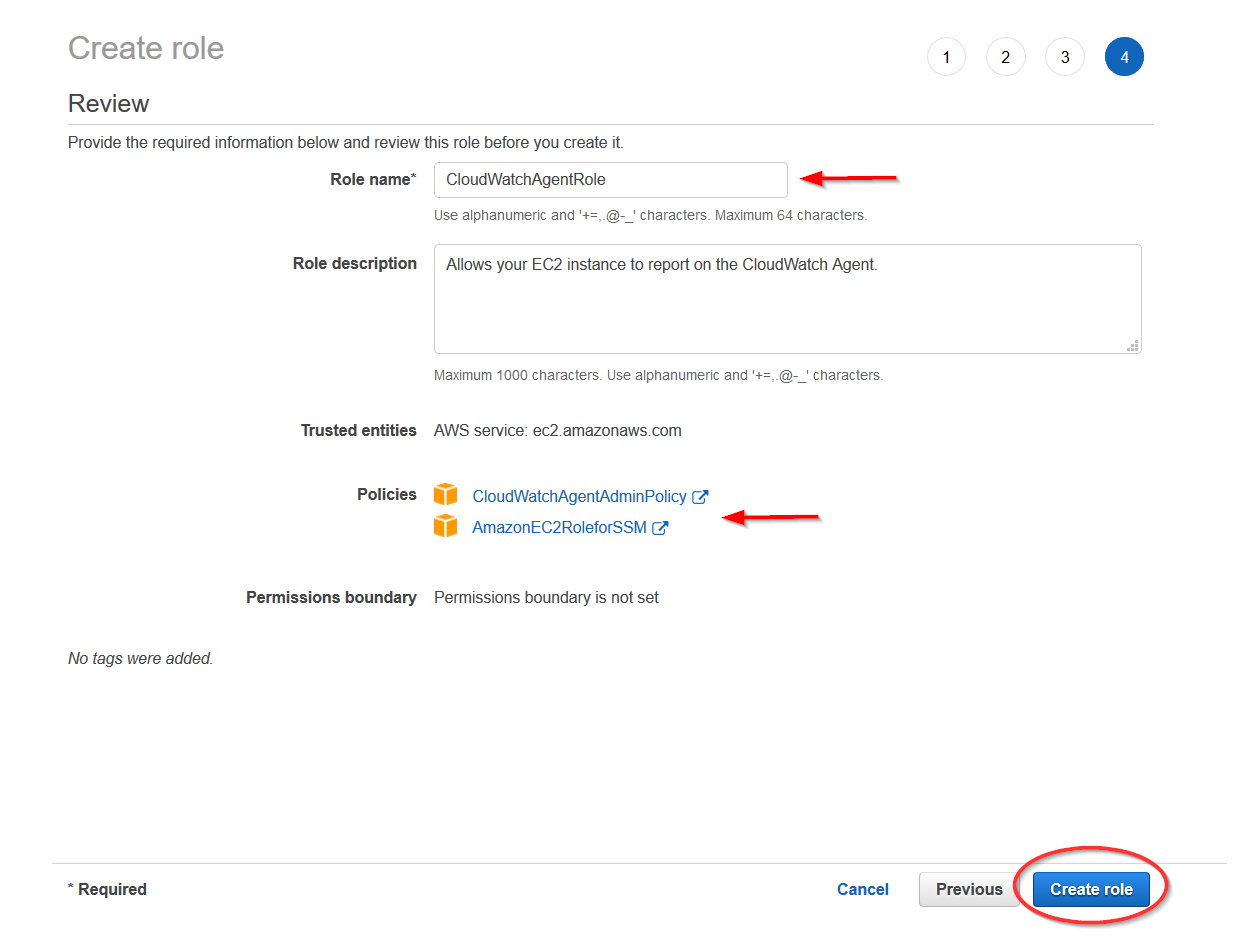
- Write down the name of the role and save it in a safe location since you will use it later in the workflow.
In this procedure, you will attach the IAM role to the EC2 instance that will use the role.
- From the AWS services page, choose Compute > EC2.
- From the EC2 Dashboard, select Instances > Instances.
- Select your EC2 instance from the list.
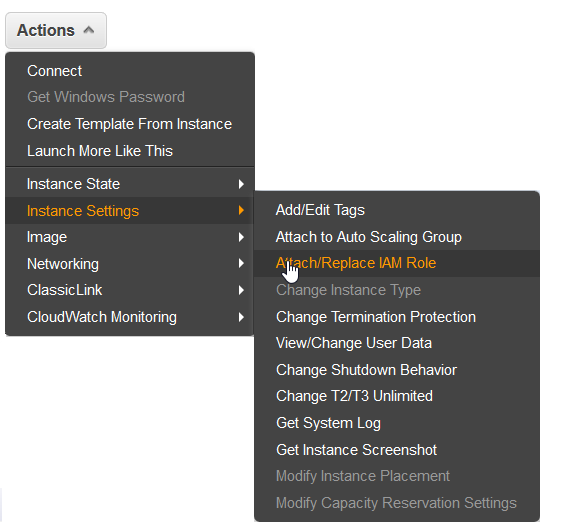
- From the Actions menu, select Instance Settings > Attach/Replace IAM Role.
- From the drop-down list, select the name of the role you created in Step 2: Create Role and Attach Policies, and click Apply.
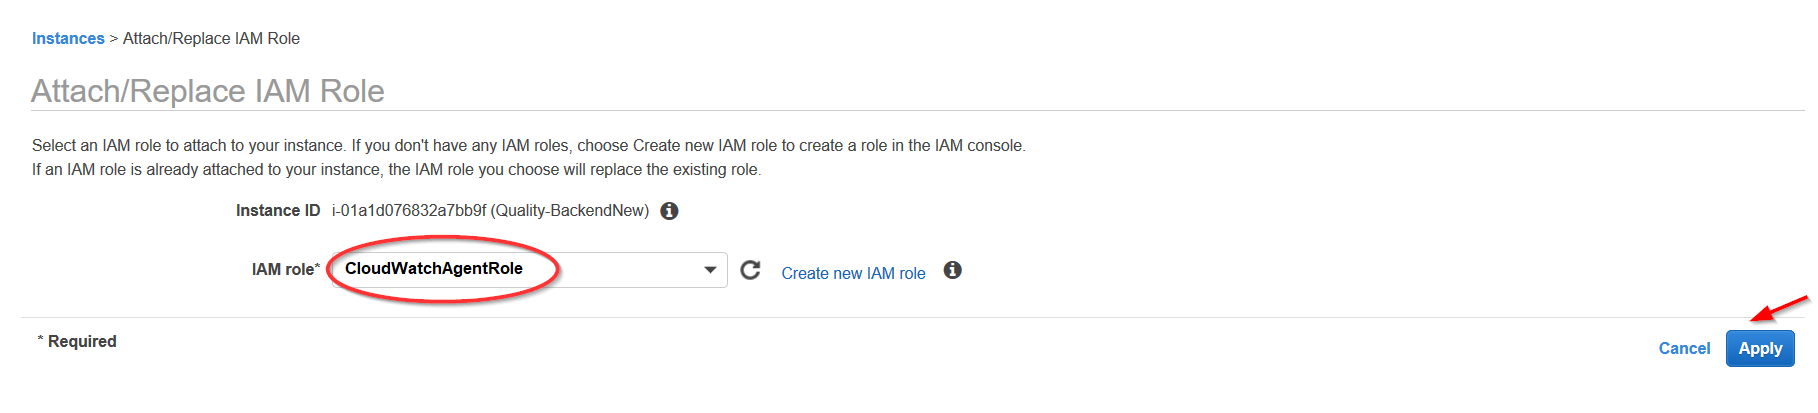
A message indicates that the role is now attached to your EC2 instance.
- Click Close.
- From the AWS services page, choose Management & Governance > Systems Manager.
- From the AWS Systems Manager Dashboard, select Instances & Nodes > Run Command.
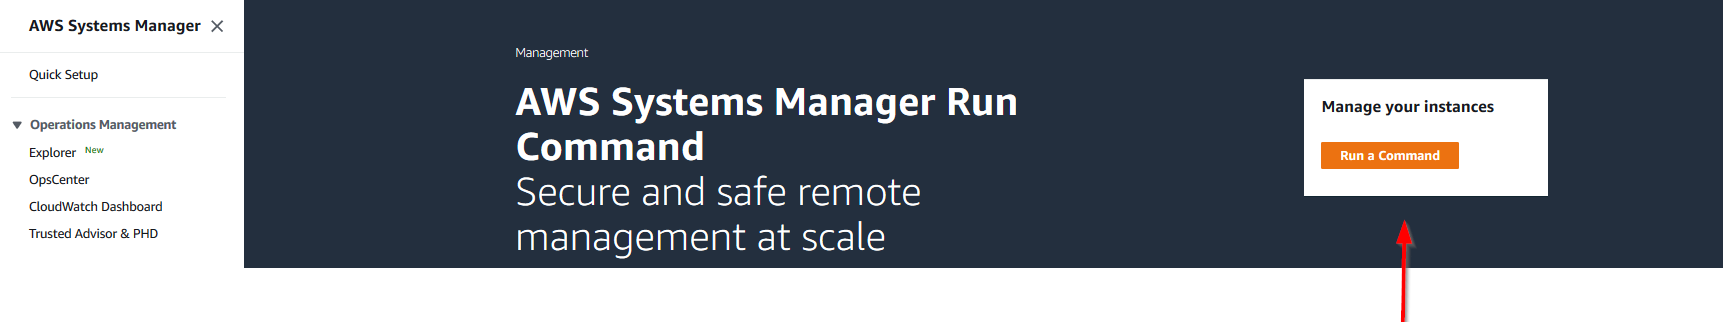
- From the right side of the screen, click the Run a Command button.
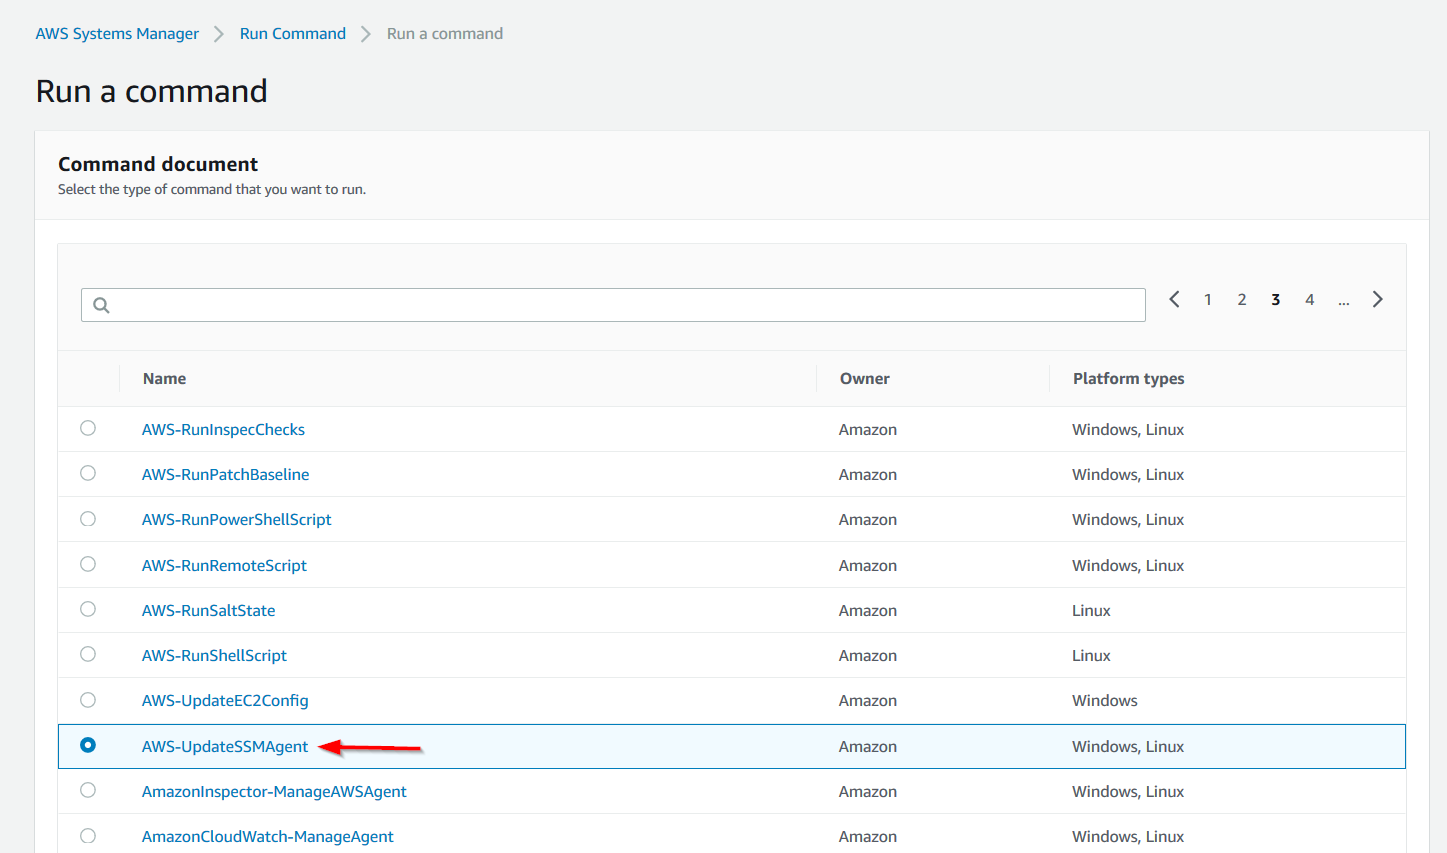
- On the Run a command page, select AWS-UpdateSSMAgent from the list.
- Scroll down to the Targets section and select the Choose instances manually radio button.
- Select your EC2 instance.
 If you don't see your EC2 instance, the AMI may not include the SSM agent or the role with required SSM permissions may not be attached.
- If you need to install the SSM agent, review the Install and Configure SSM Agent instructions.
- If you need to attach a role, attach the role you created in Step 3: Attach a Role to EC2 Instance.
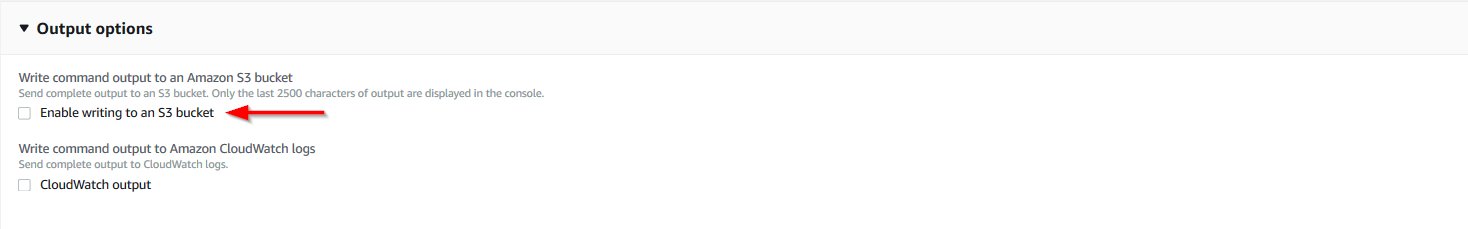
- Scroll down to the Output options section, and de-select the Enable writing to an S3 bucket checkbox.
- At the bottom of the page, click Run.
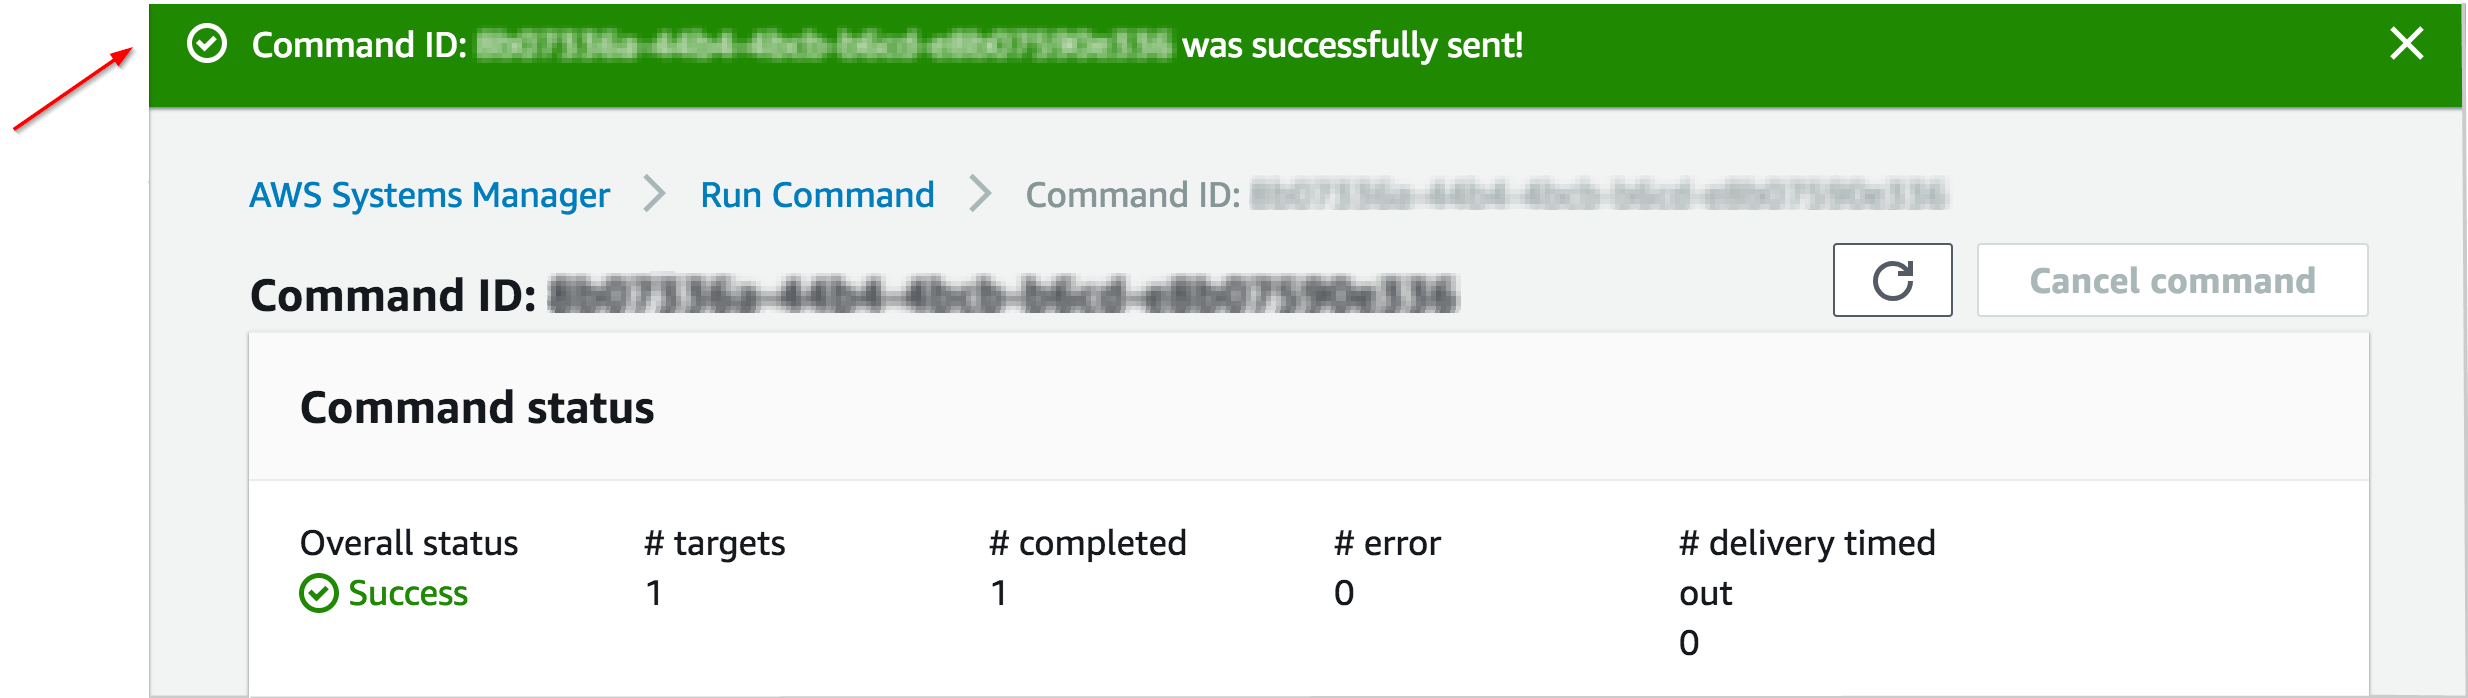
- Verify that the command ran successfully, which AWS will indicate with a message like the one on the following screen:
- From the AWS services page, choose Management & Governance > Systems Manager.
- From the AWS Systems Manager Dashboard, select Instances & Nodes > Run Command.
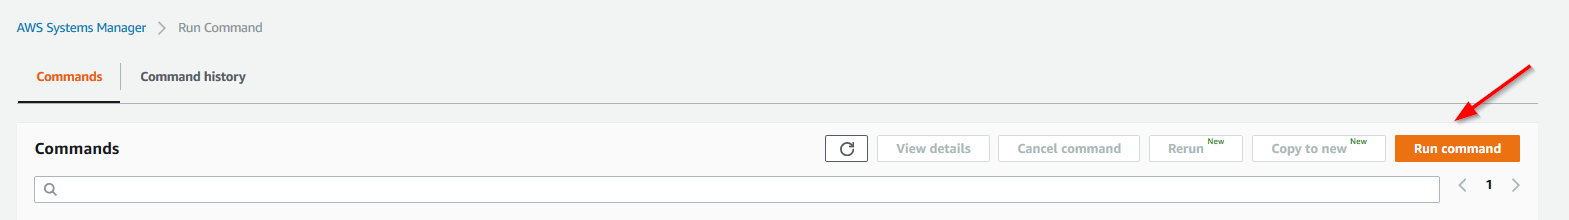
- From the right side of the screen, click the Run command button.
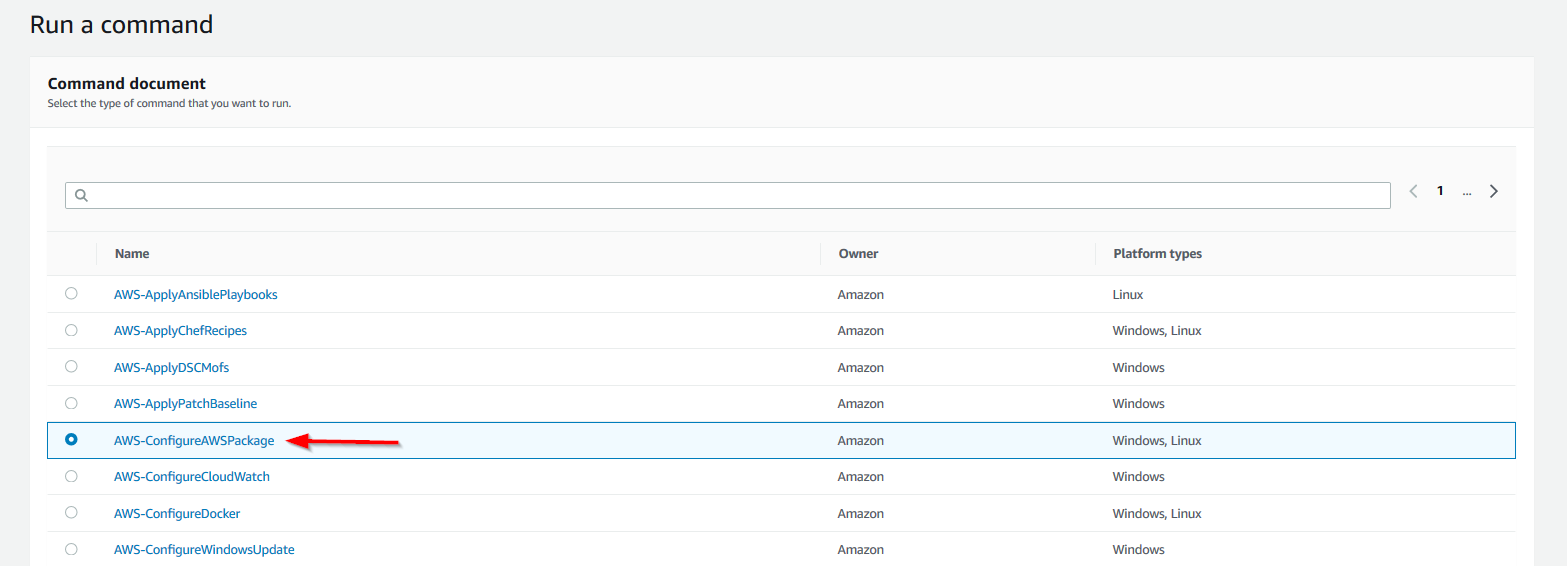
- On the Run a command page, select AWS-ConfigAWSPackage from the list.
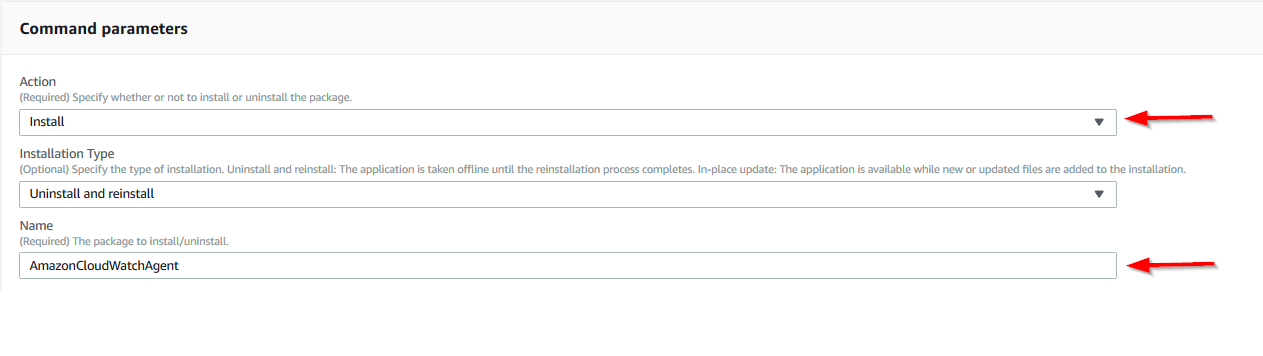
- In the Command parameters section:
- Select Install from the Actions drop-down menu.
- Type AmazonCloudWatchAgent in the Name text field.
- Scroll down to the Targets section and select the Choose instances manually radio button.
- Select your EC2 instance.
- Scroll down to the Output options section, and de-select the Enable writing to an S3 bucket checkbox.
- At the bottom of the page, click Run.
- Verify that the command ran successfully, which AWS will indicate with a message at the top of the screen.
- RDP into your EC2 instance.
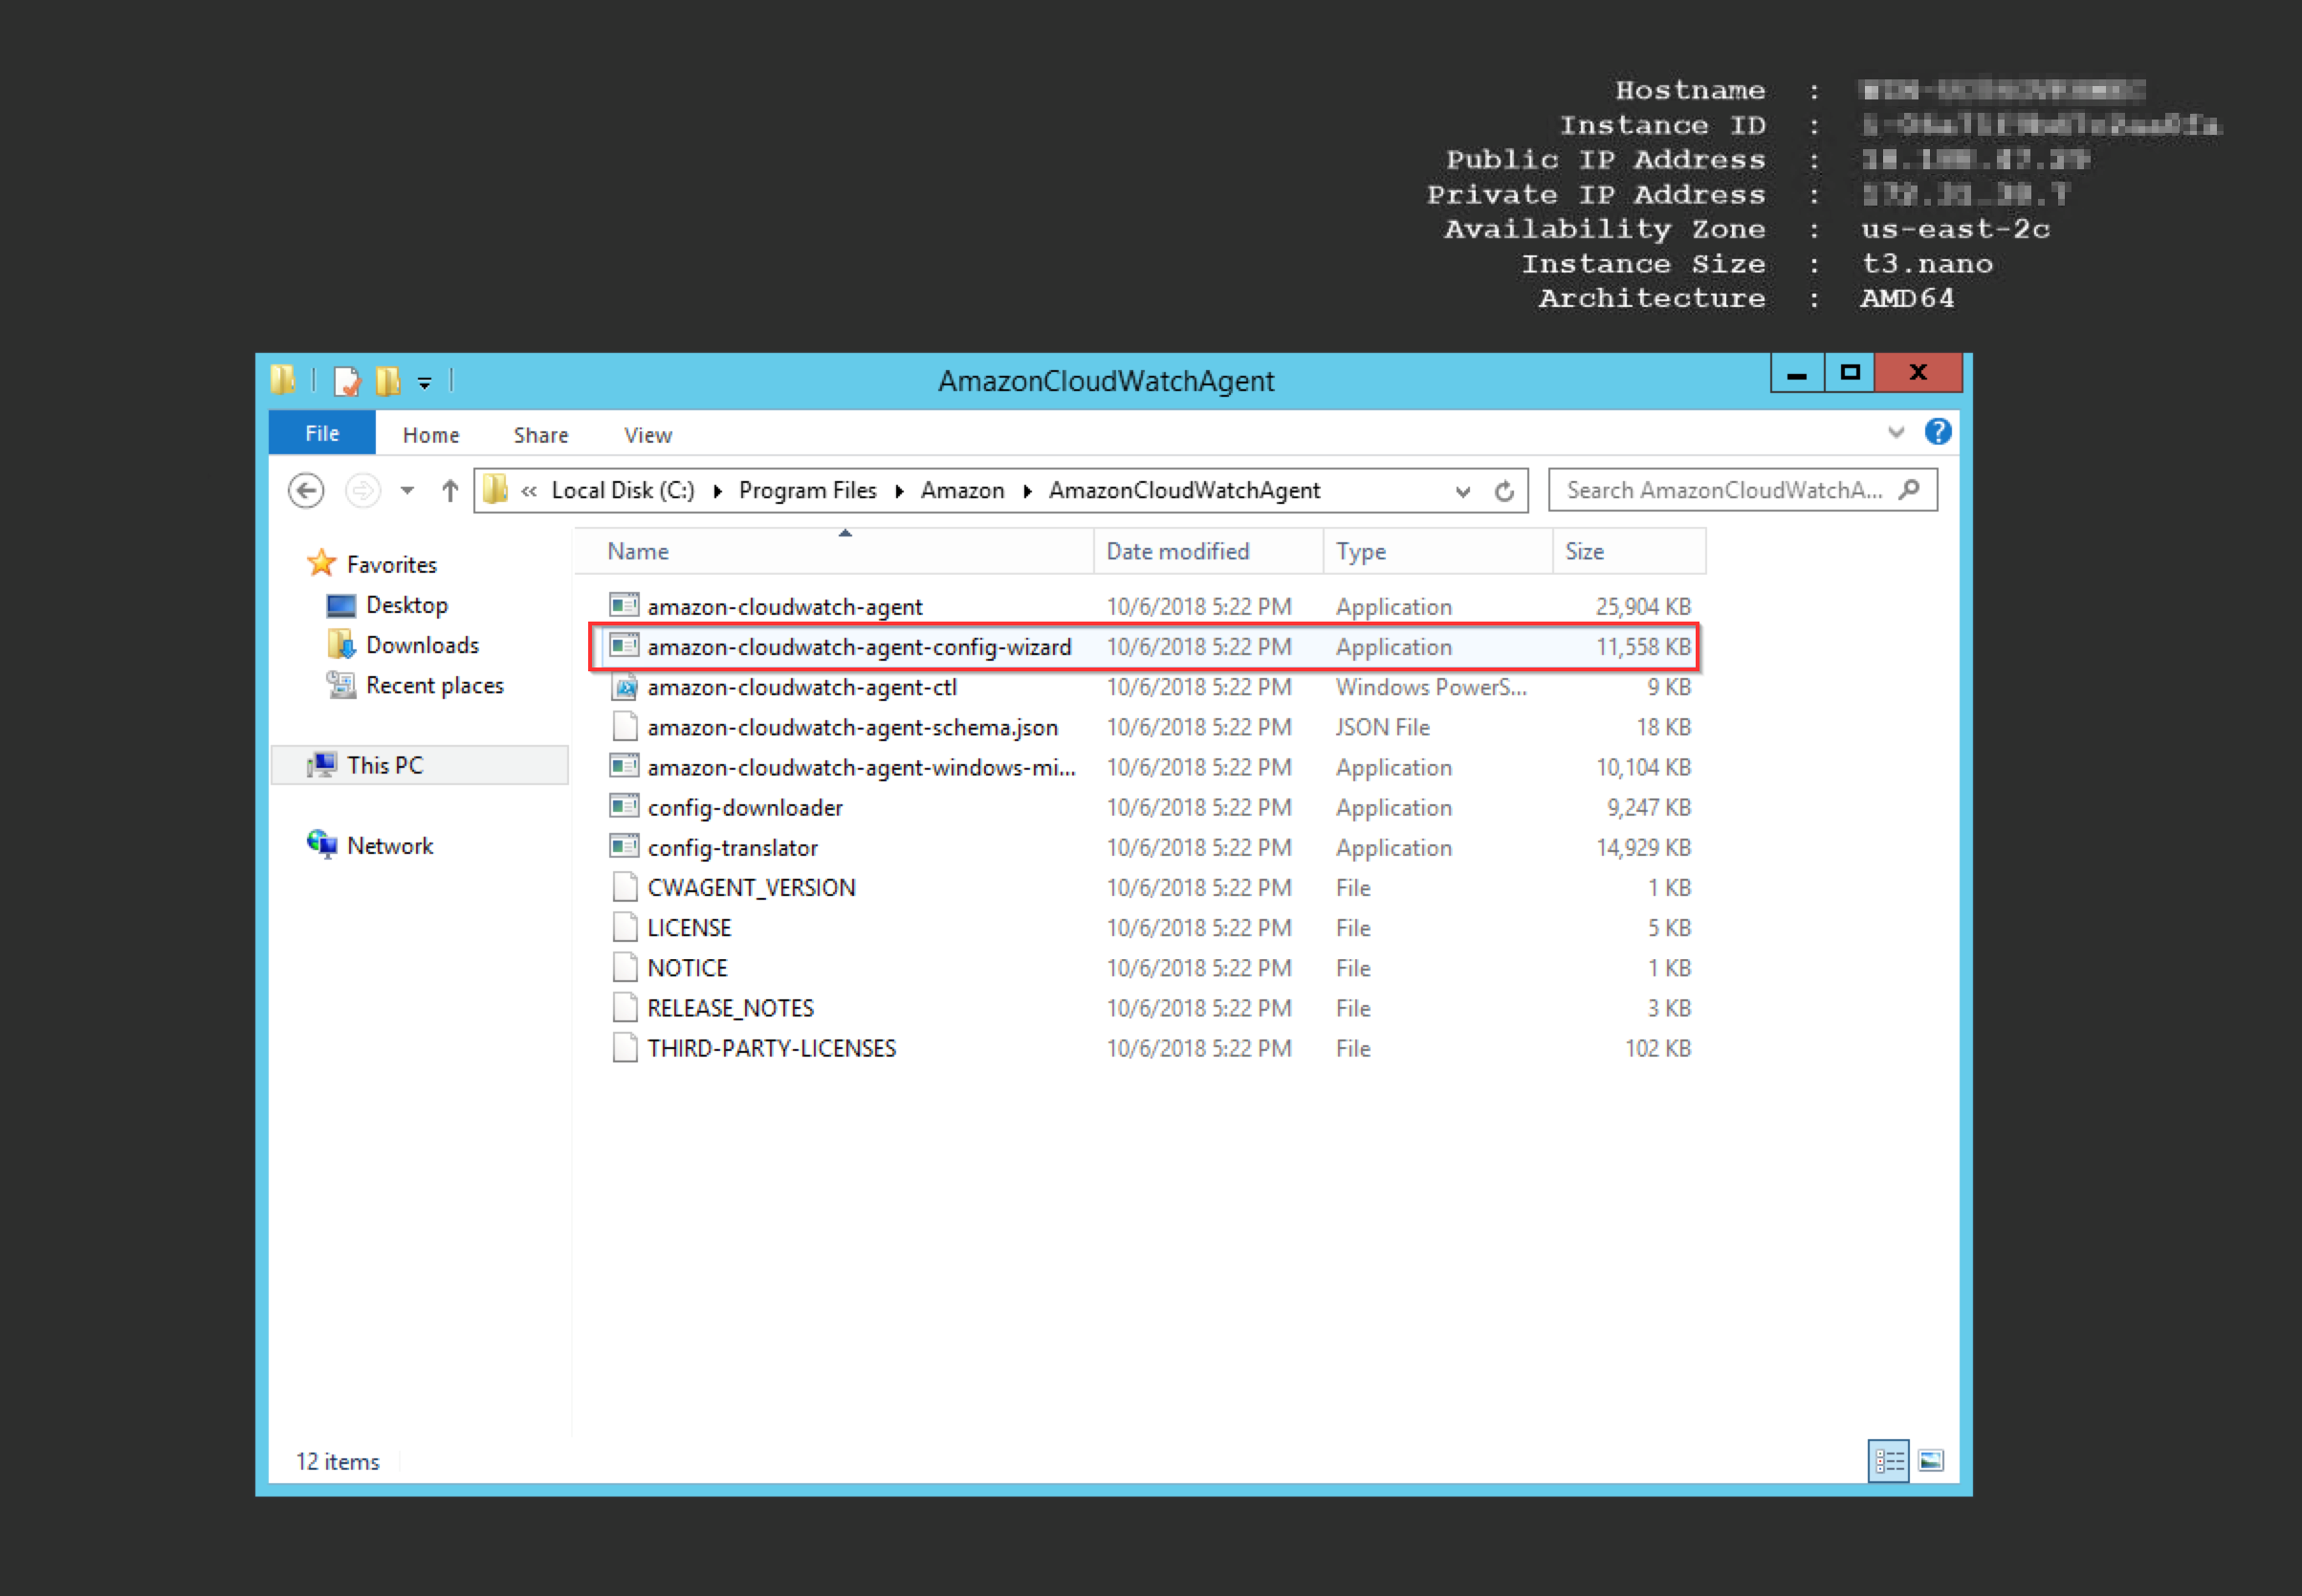
- Navigate to C: Program Files > Amazon > Amazon CloudWatch Agent and click to launch the CloudWatch Agent Config Wizard.
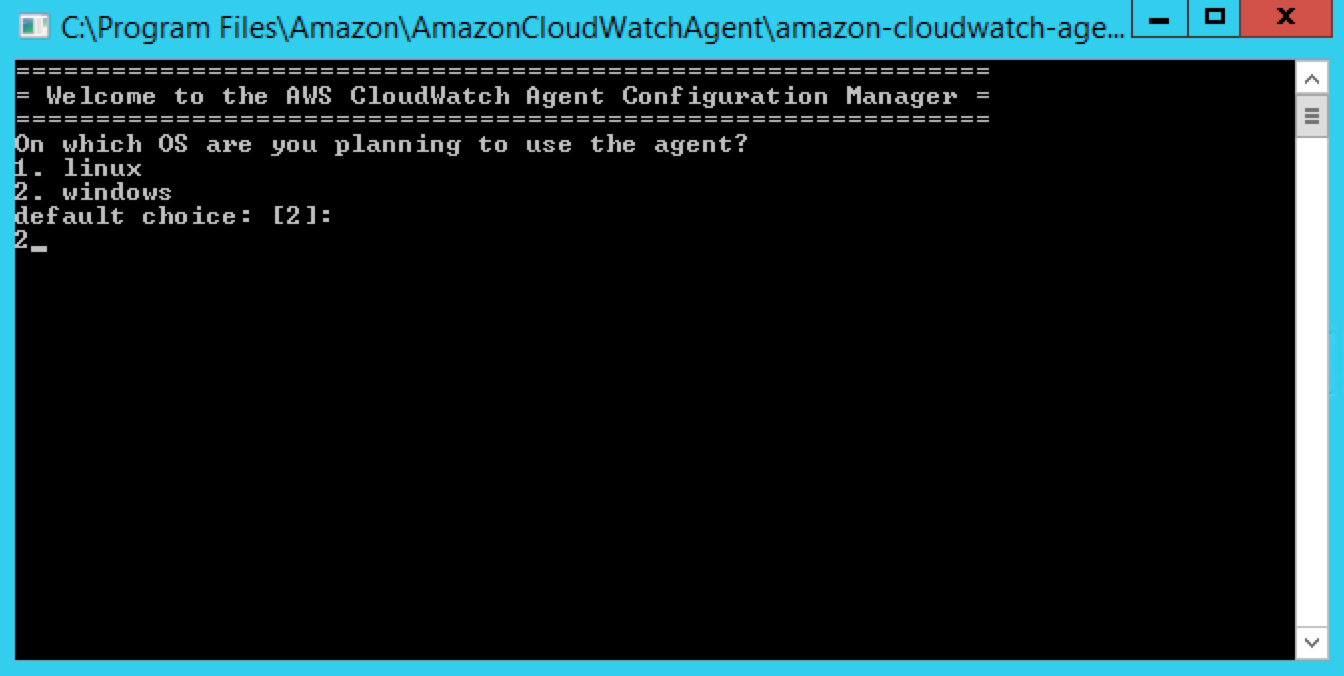
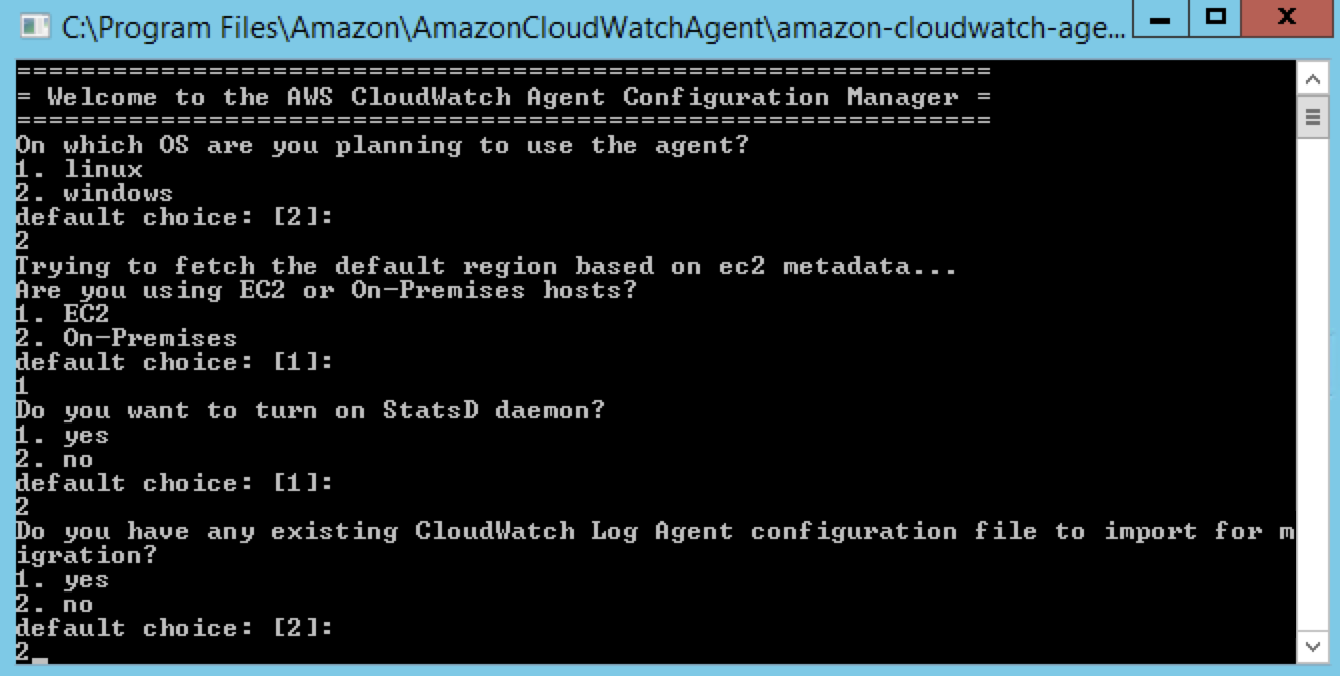
- Type 2 to select Windows as your operating system.
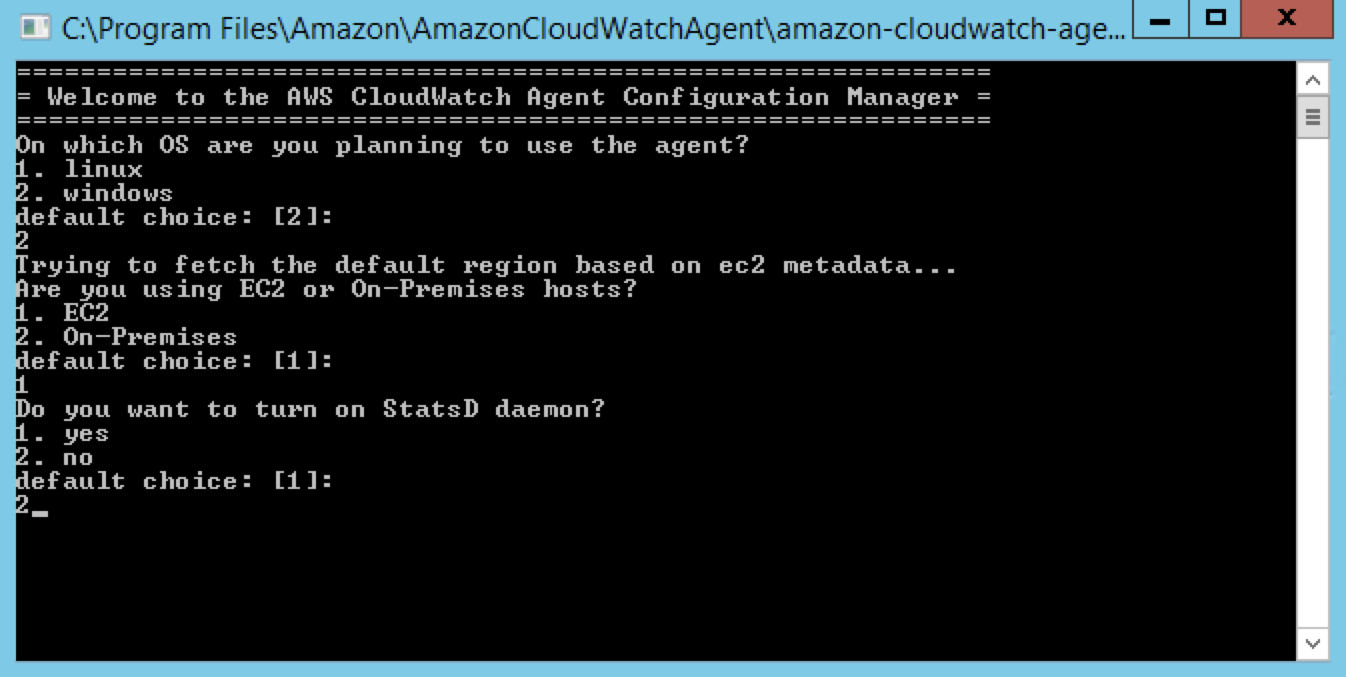
- Type 1 to select EC2 as your host, and type 2 to indicate that you do not want to turn on StatsD daemon.
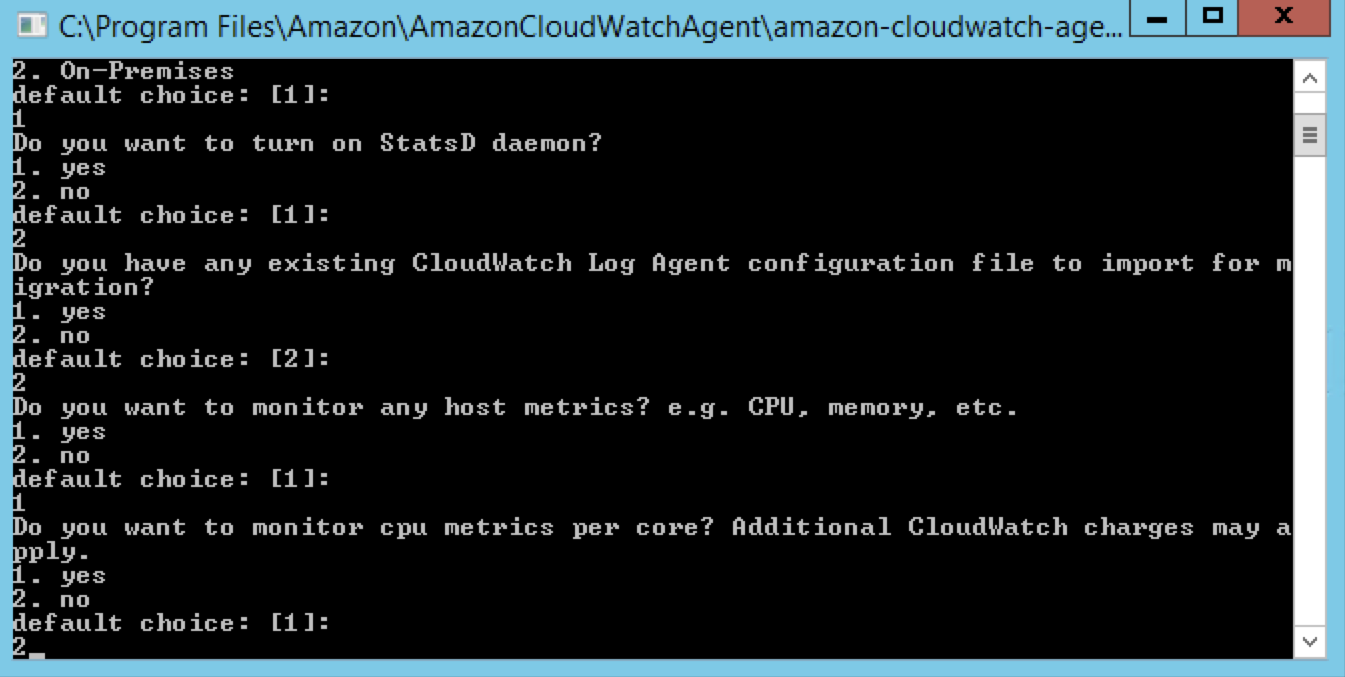
- Type 2 to indicate that this is the first time you are running the CloudWatch Log Agent file.
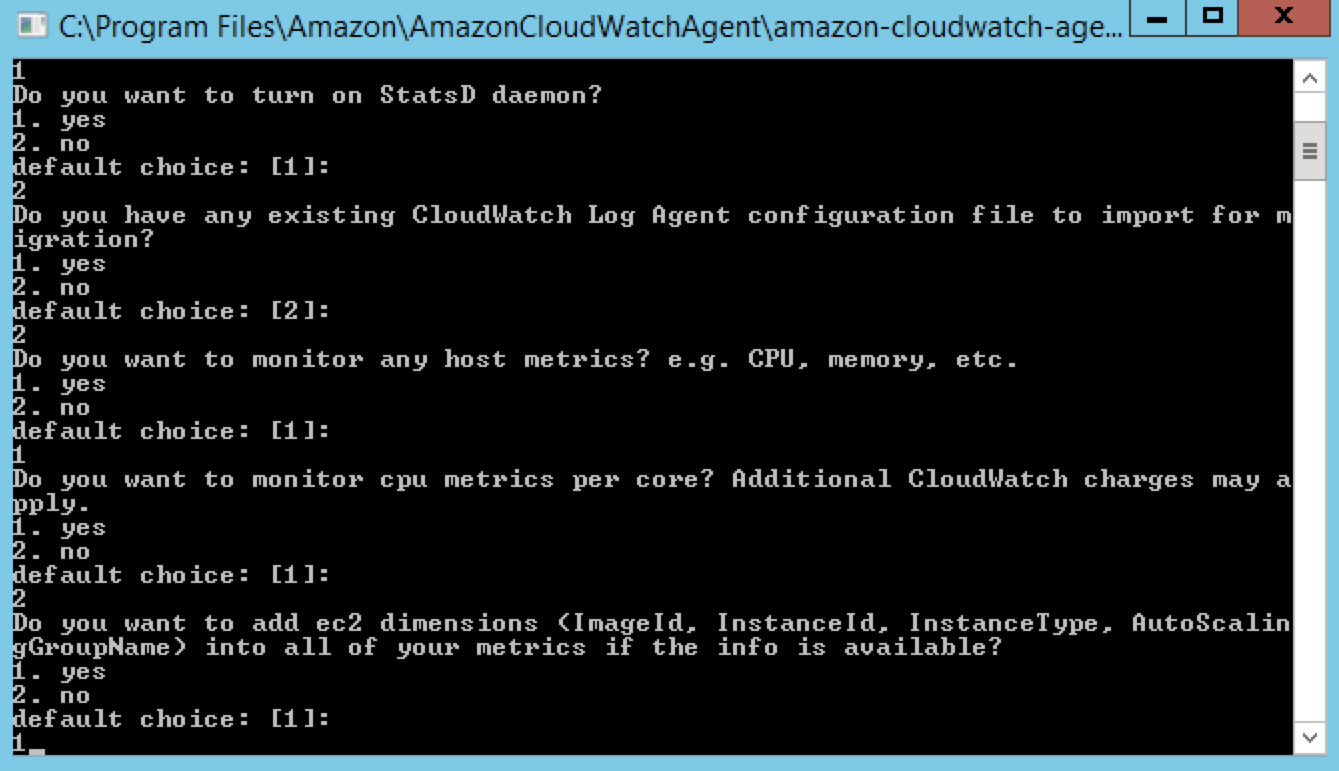
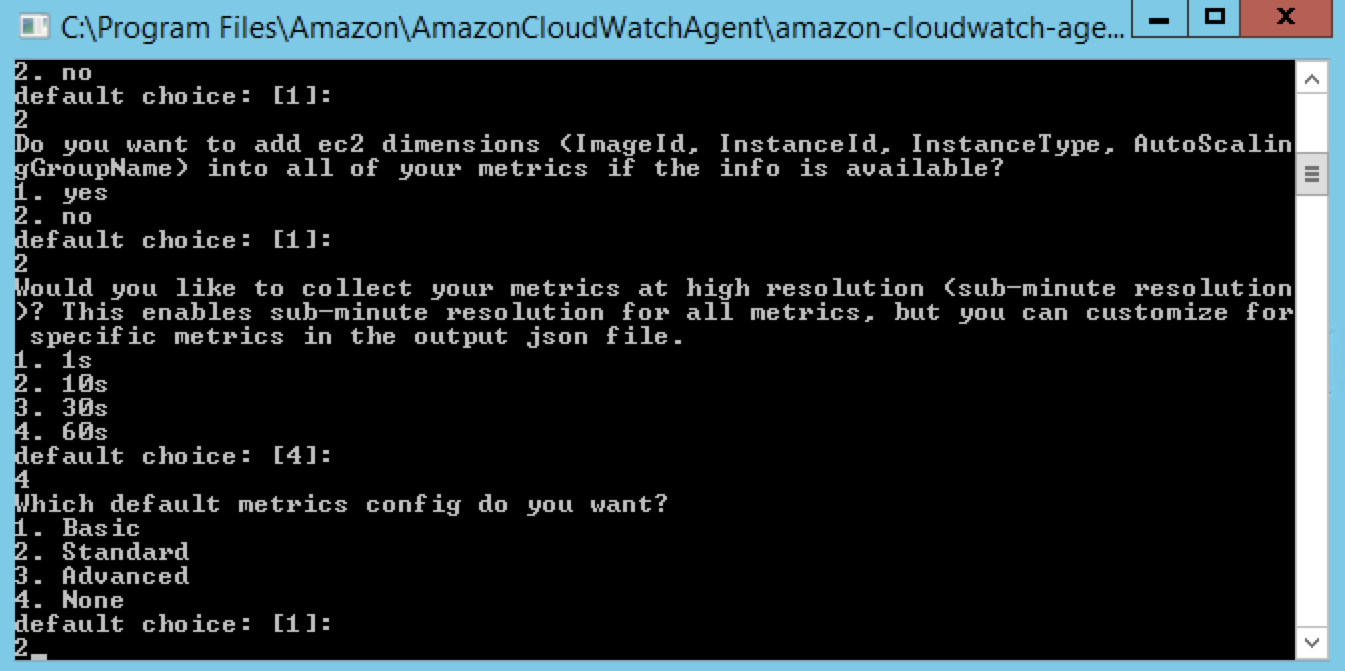
- Type 1 to indicate that you want to monitor memory metrics and type 2 to indicate that you do not want to monitor CPU metrics by core, which will minimize your costs.
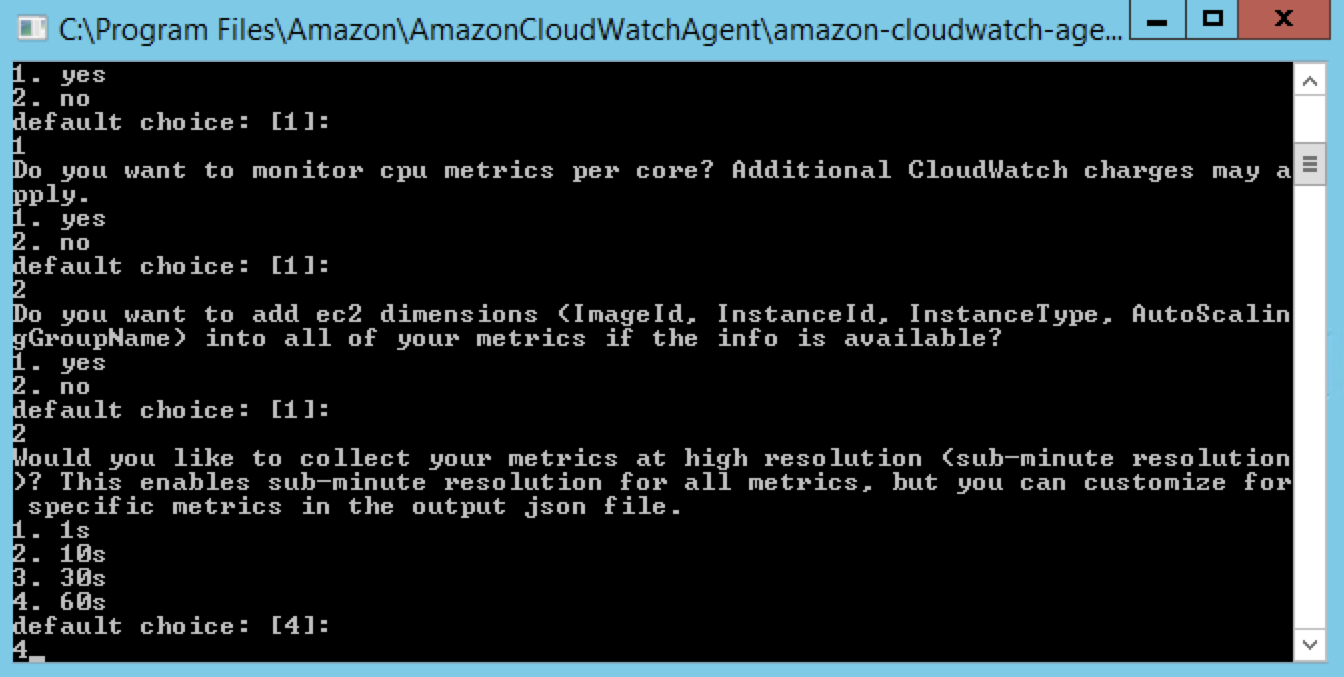
- Type 1 to indicate that you want to add specific dimensions.
 CloudCheckr requires that CloudWatch includes a dimension of instance id in all its reported memory metrics. If you don't select this option, CloudWatch will report the memory metrics with a dimension of the host name and CloudCheckr won't be able to import the metrics.
 - Type 4 to indicate that you want to report on metrics every minute. This is the most cost-effective option.
- Type 2 to indicate that you want Standard as your default metrics config. This is the CloudCheckr recommendation.
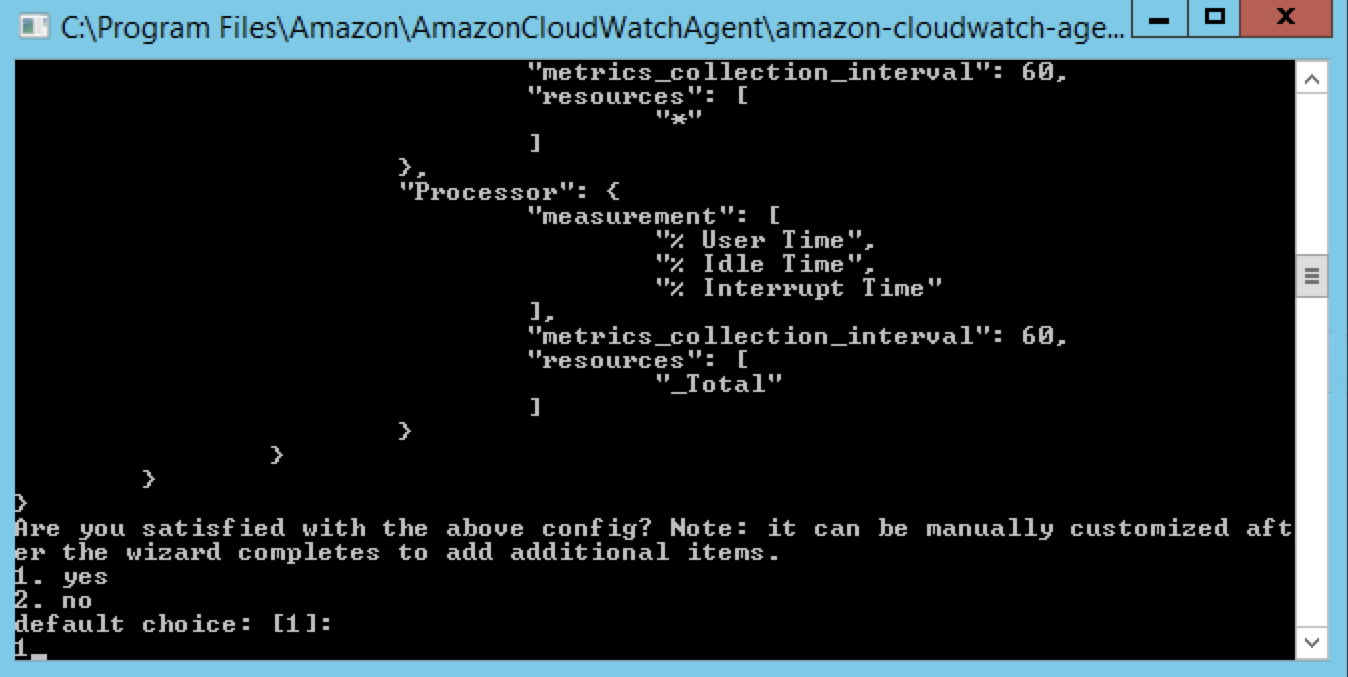
- Type 1 to indicate that your configuration is accurate and complete.
The wizard will build a JSON file based on your configuration.
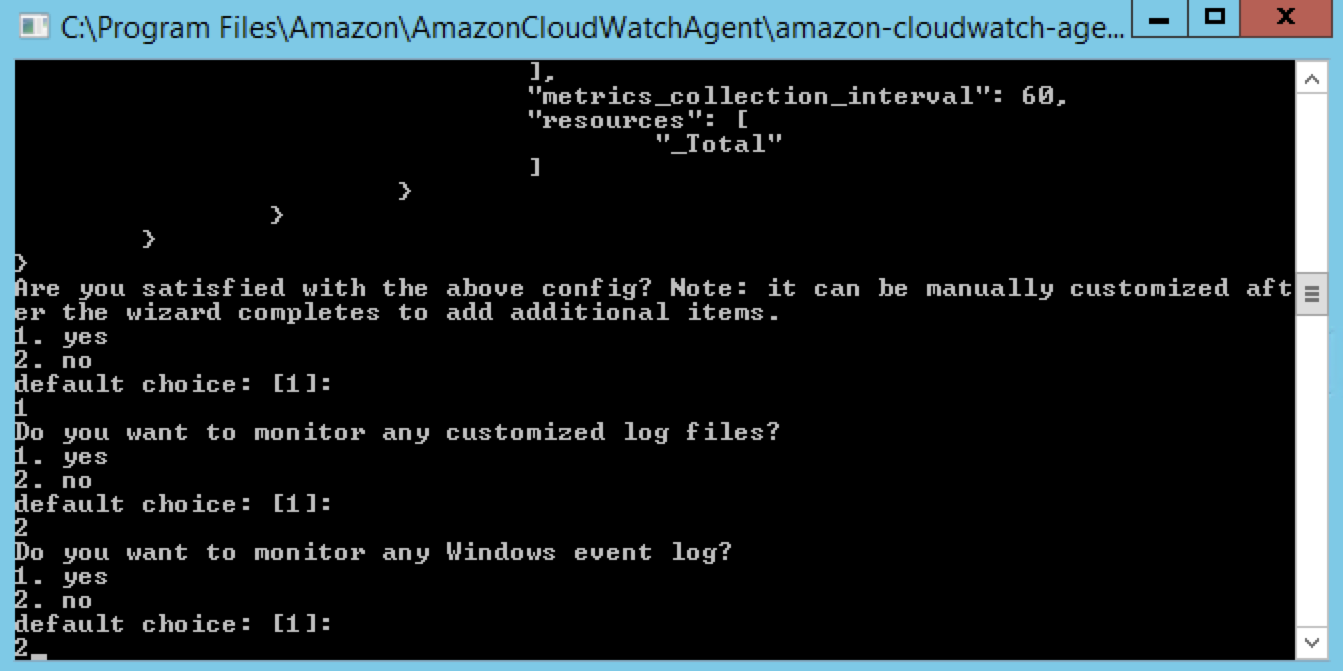
- Type 2 to indicate that you don't want to monitor any customized log files and type 2 to indicate that you don't want to monitor any Windows event logs.
- Type 1 to indicate that you want to store this information in the Parameter store since this is your first configuration.
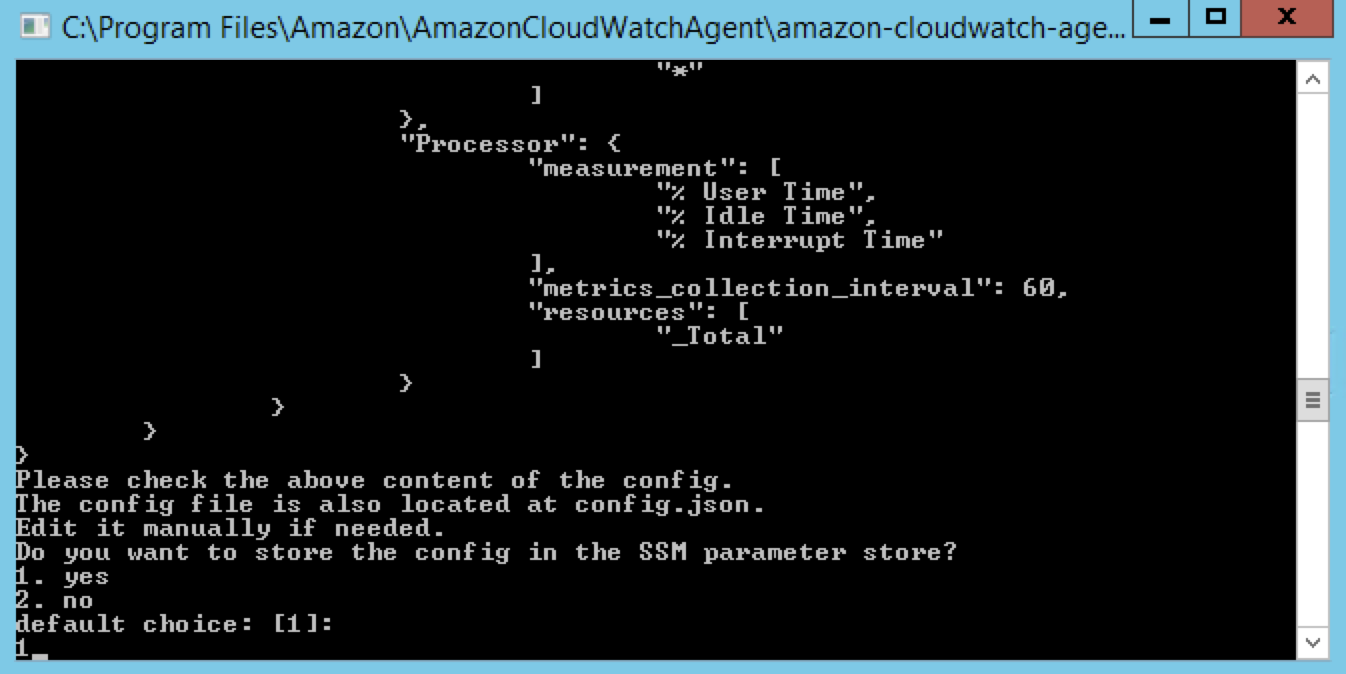
- Type a name for the Parameter store you want to select. In this example, we used AmazonCloudWatch-windows.
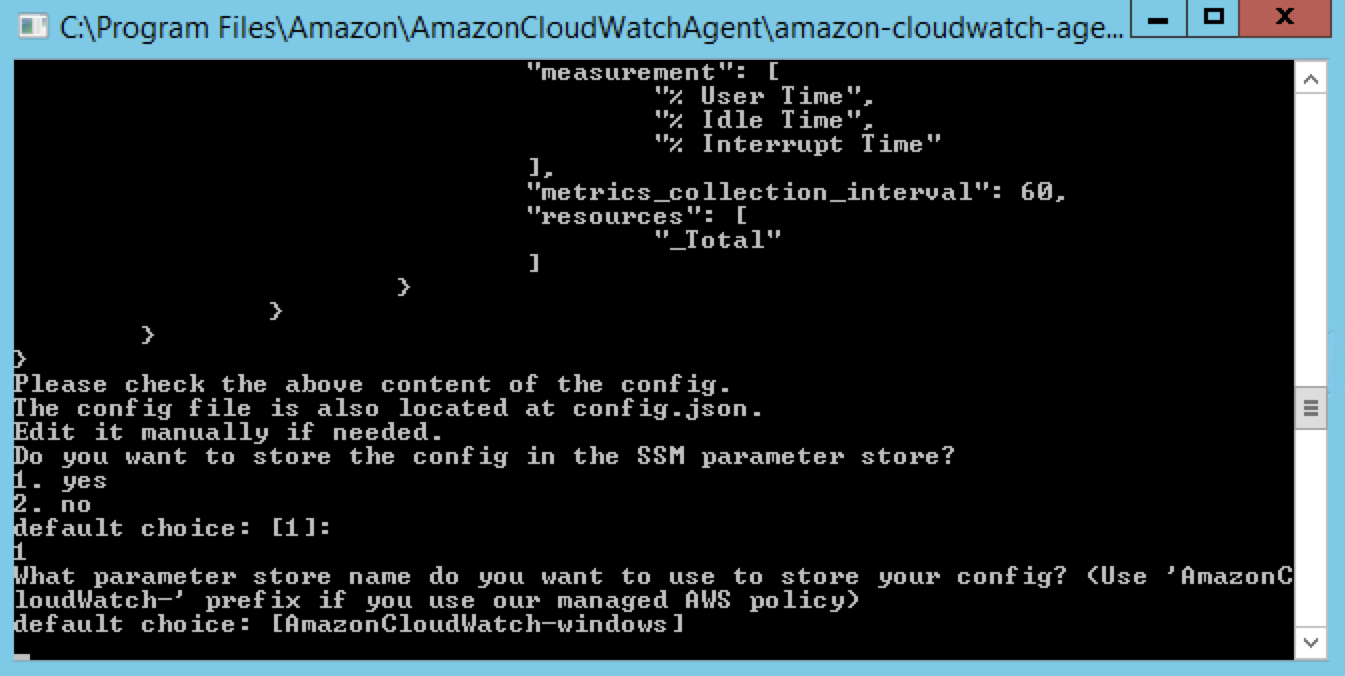 Write down this name since you'll use it later in the workflow.
 - Press ENTER to select the default region.
- Type 1 to use your role for credentials.
The access key is the temporary access key of the assume role previously attached to the EC2 instance.
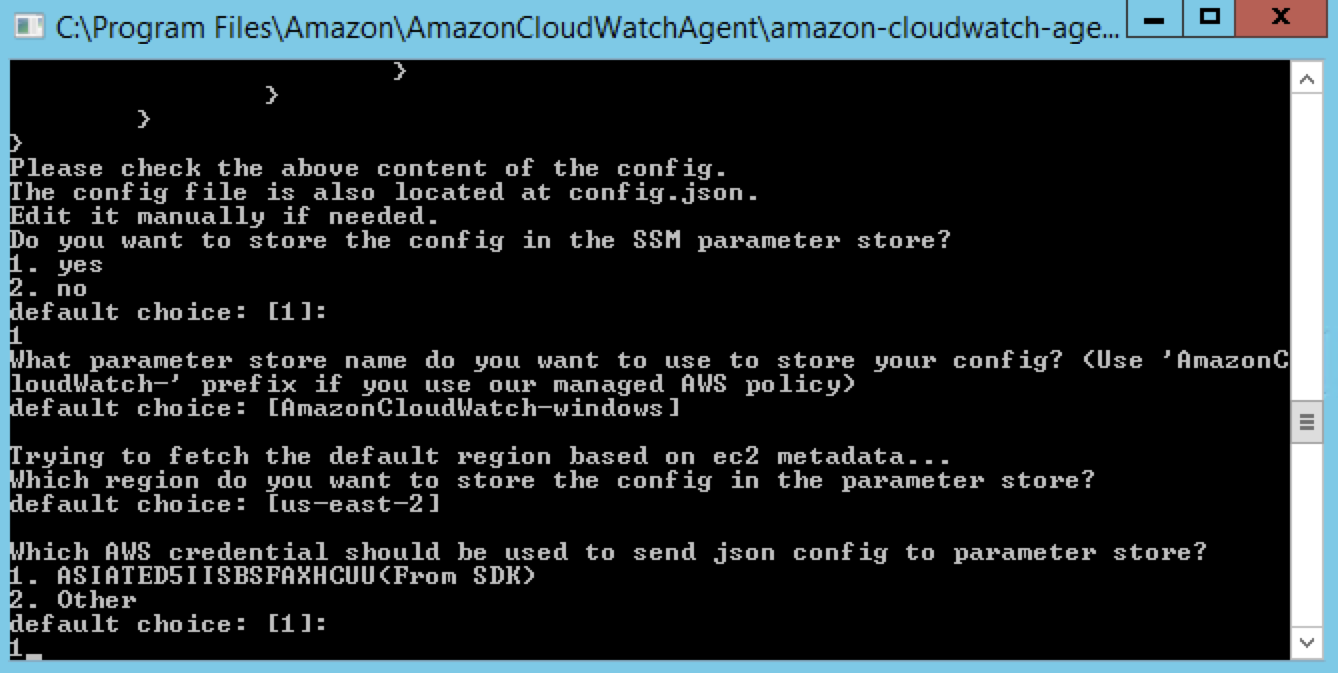
- Press ENTER to complete the wizard.
- From the AWS services page, choose Management & Governance > Systems Manager.
- From the AWS Systems Manager Dashboard, select Instances & Nodes > Run Command.
- From the right side of the screen, click the Run command button.
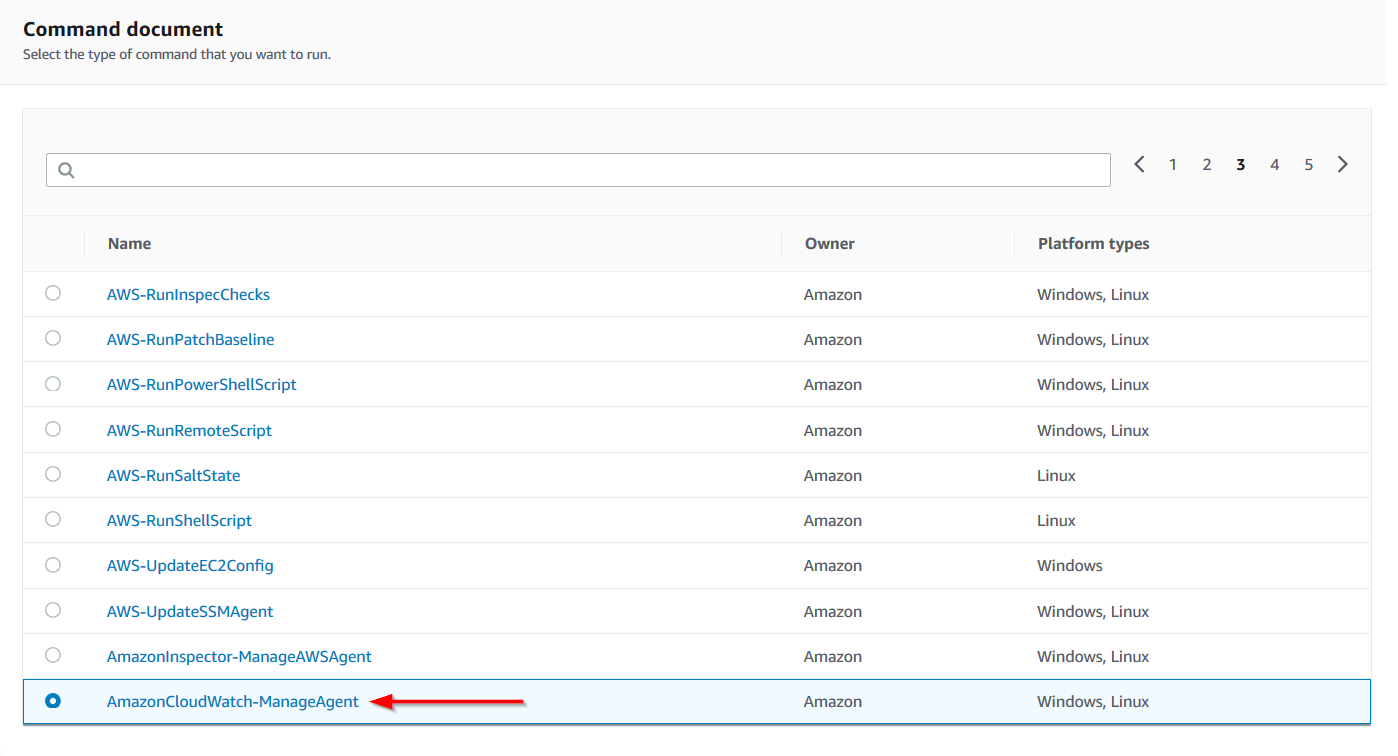
- On the Run a command page, select AmazonCloudWatch-ManageAgent from the list.
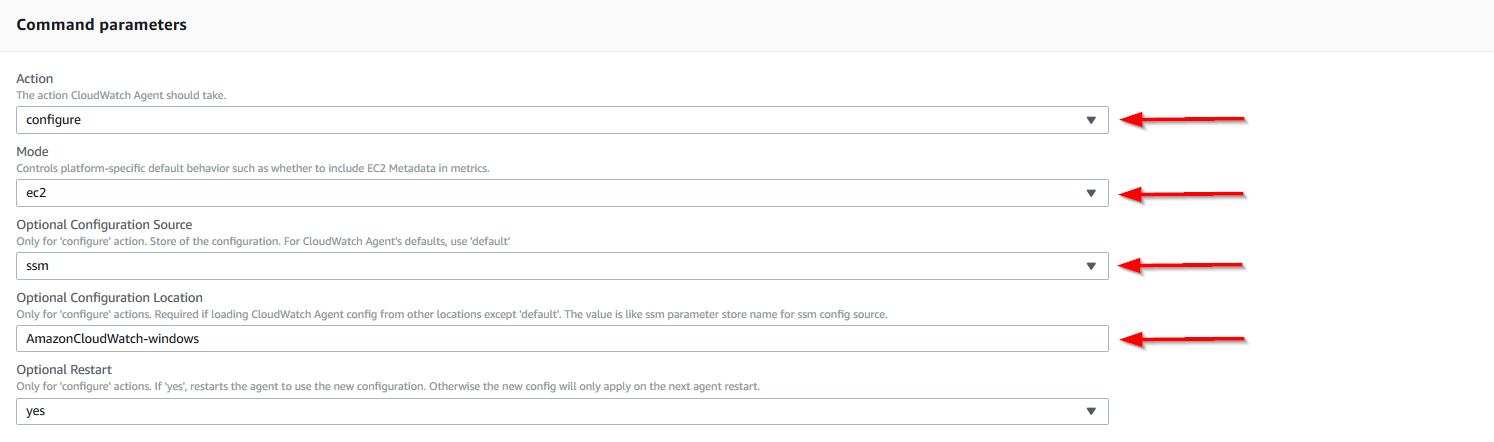
- In the Command parameters section:
- Select configure from the Actions drop-down menu.
- Select ec2 from the Mode drop-down menu.
- Select ssm from the Optional Configuration Source drop-down menu.
- Type AmazonCloudWatch-windows in the Optional Configuration Location text field.
- Scroll down to the Targets section and select the Choose instances manually radio button.
- Select your EC2 instance.
- Scroll down to the Output options section, and de-select the Enable writing to an S3 bucket checkbox.
- At the bottom of the page, click Run.
- Verify that the command ran successfully, which AWS will indicate with a message at the top of the screen.
- Scroll down to the Targets and outputs section, select the radio button associated with your EC2 instance, and click View output.
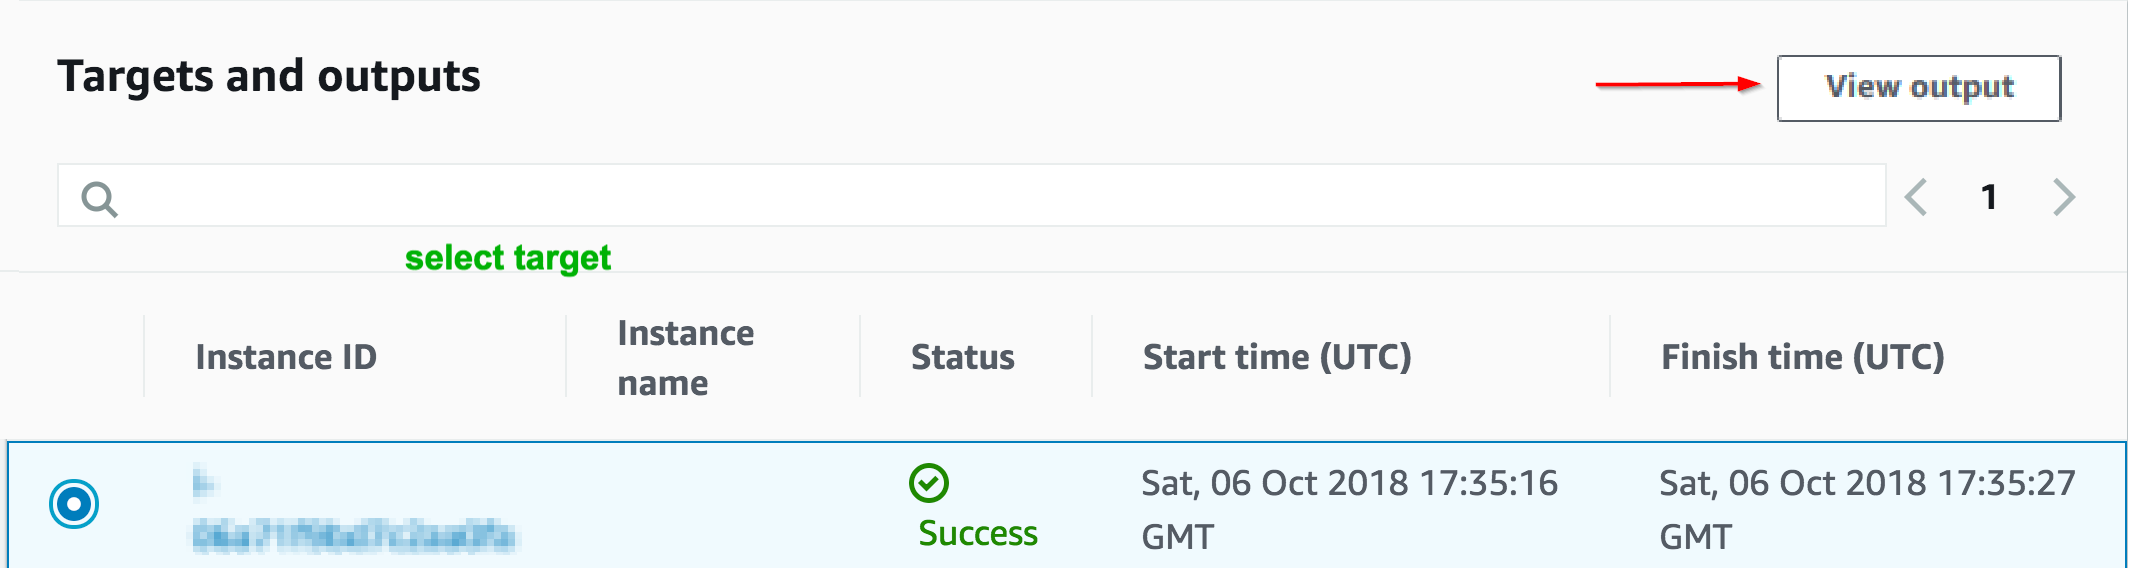
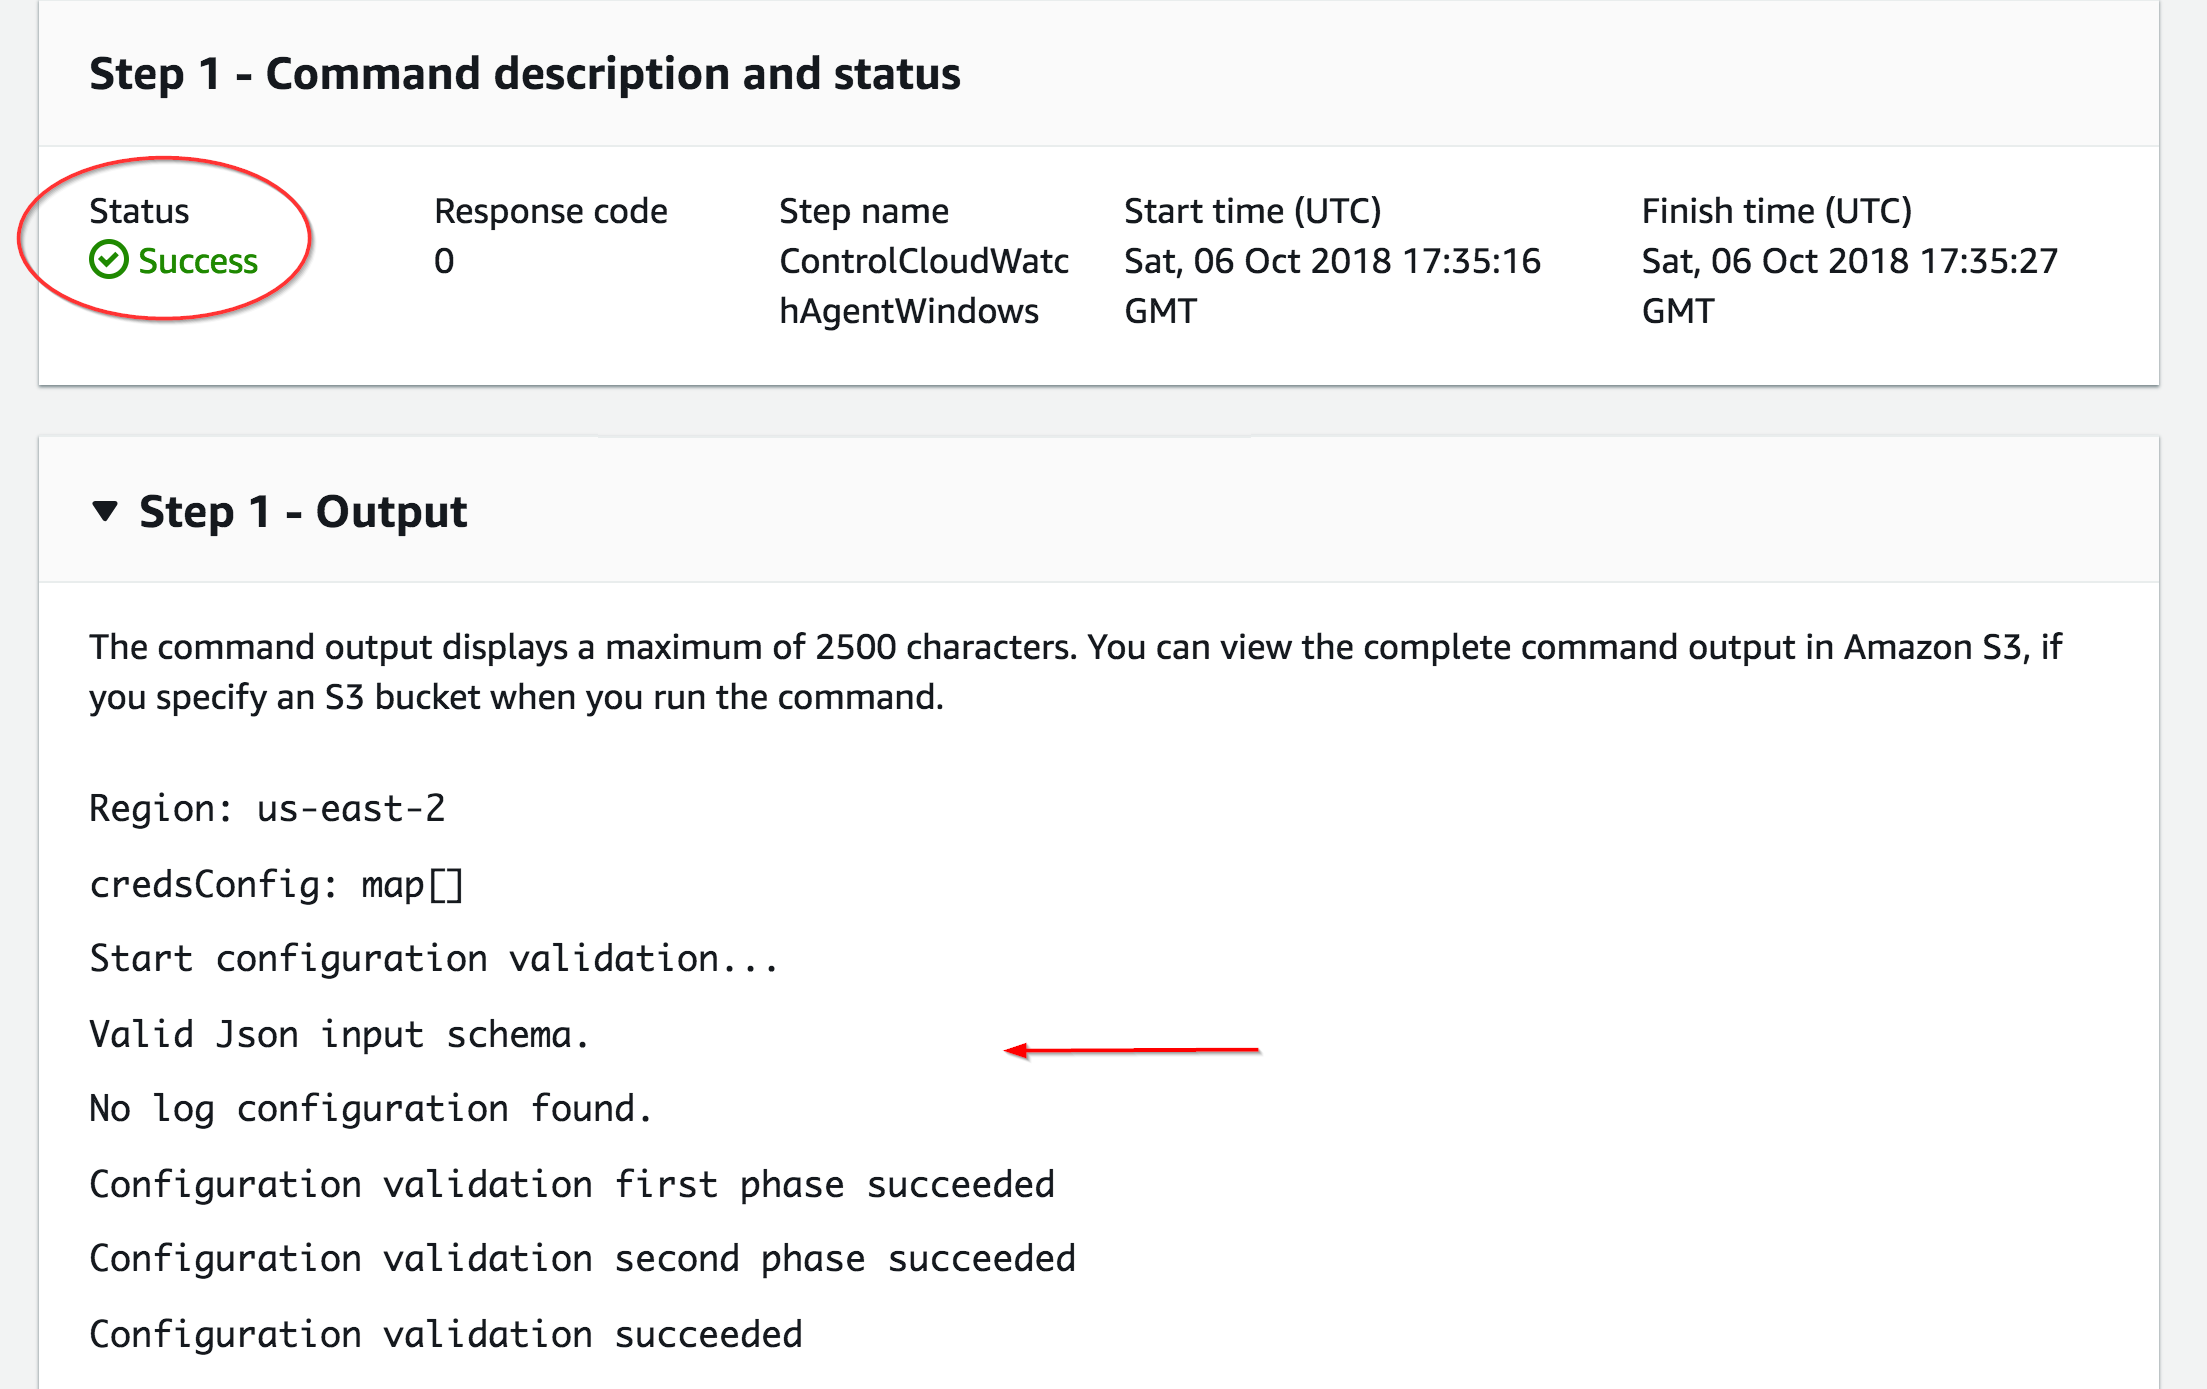
- Verify that the agent is installed and is running successfully.
- From the AWS services page, choose Management & Governance > CloudWatch.
- From the CloudWatch Dashboard, select Metrics.
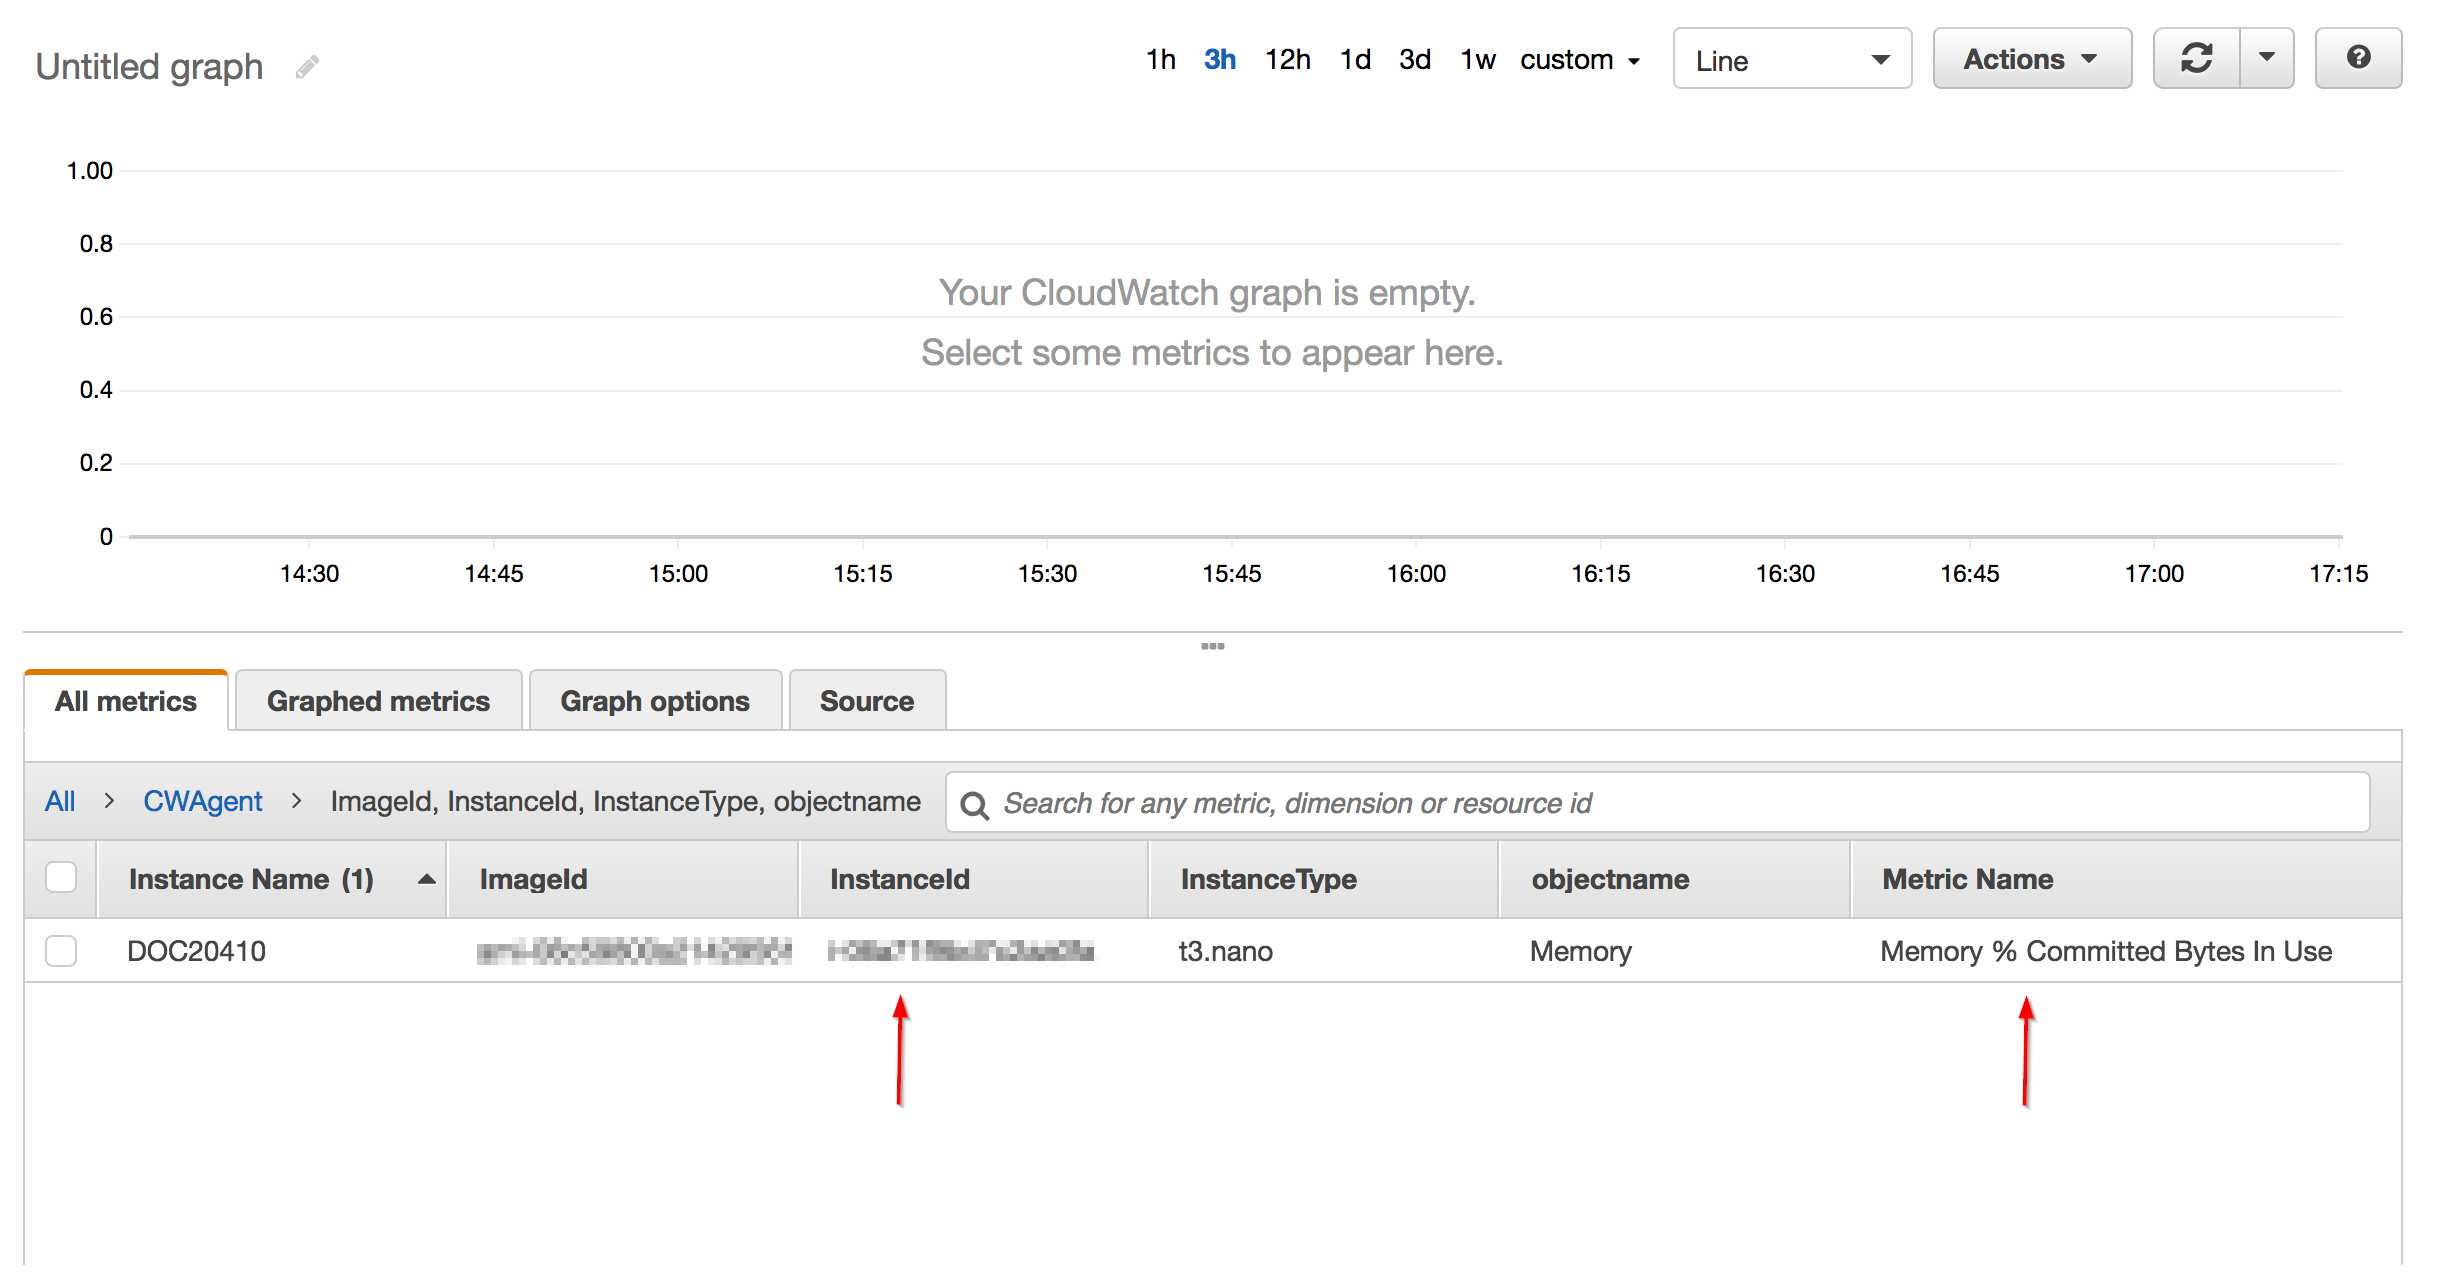
- From the All metrics tab, click the CWAgent namespace.
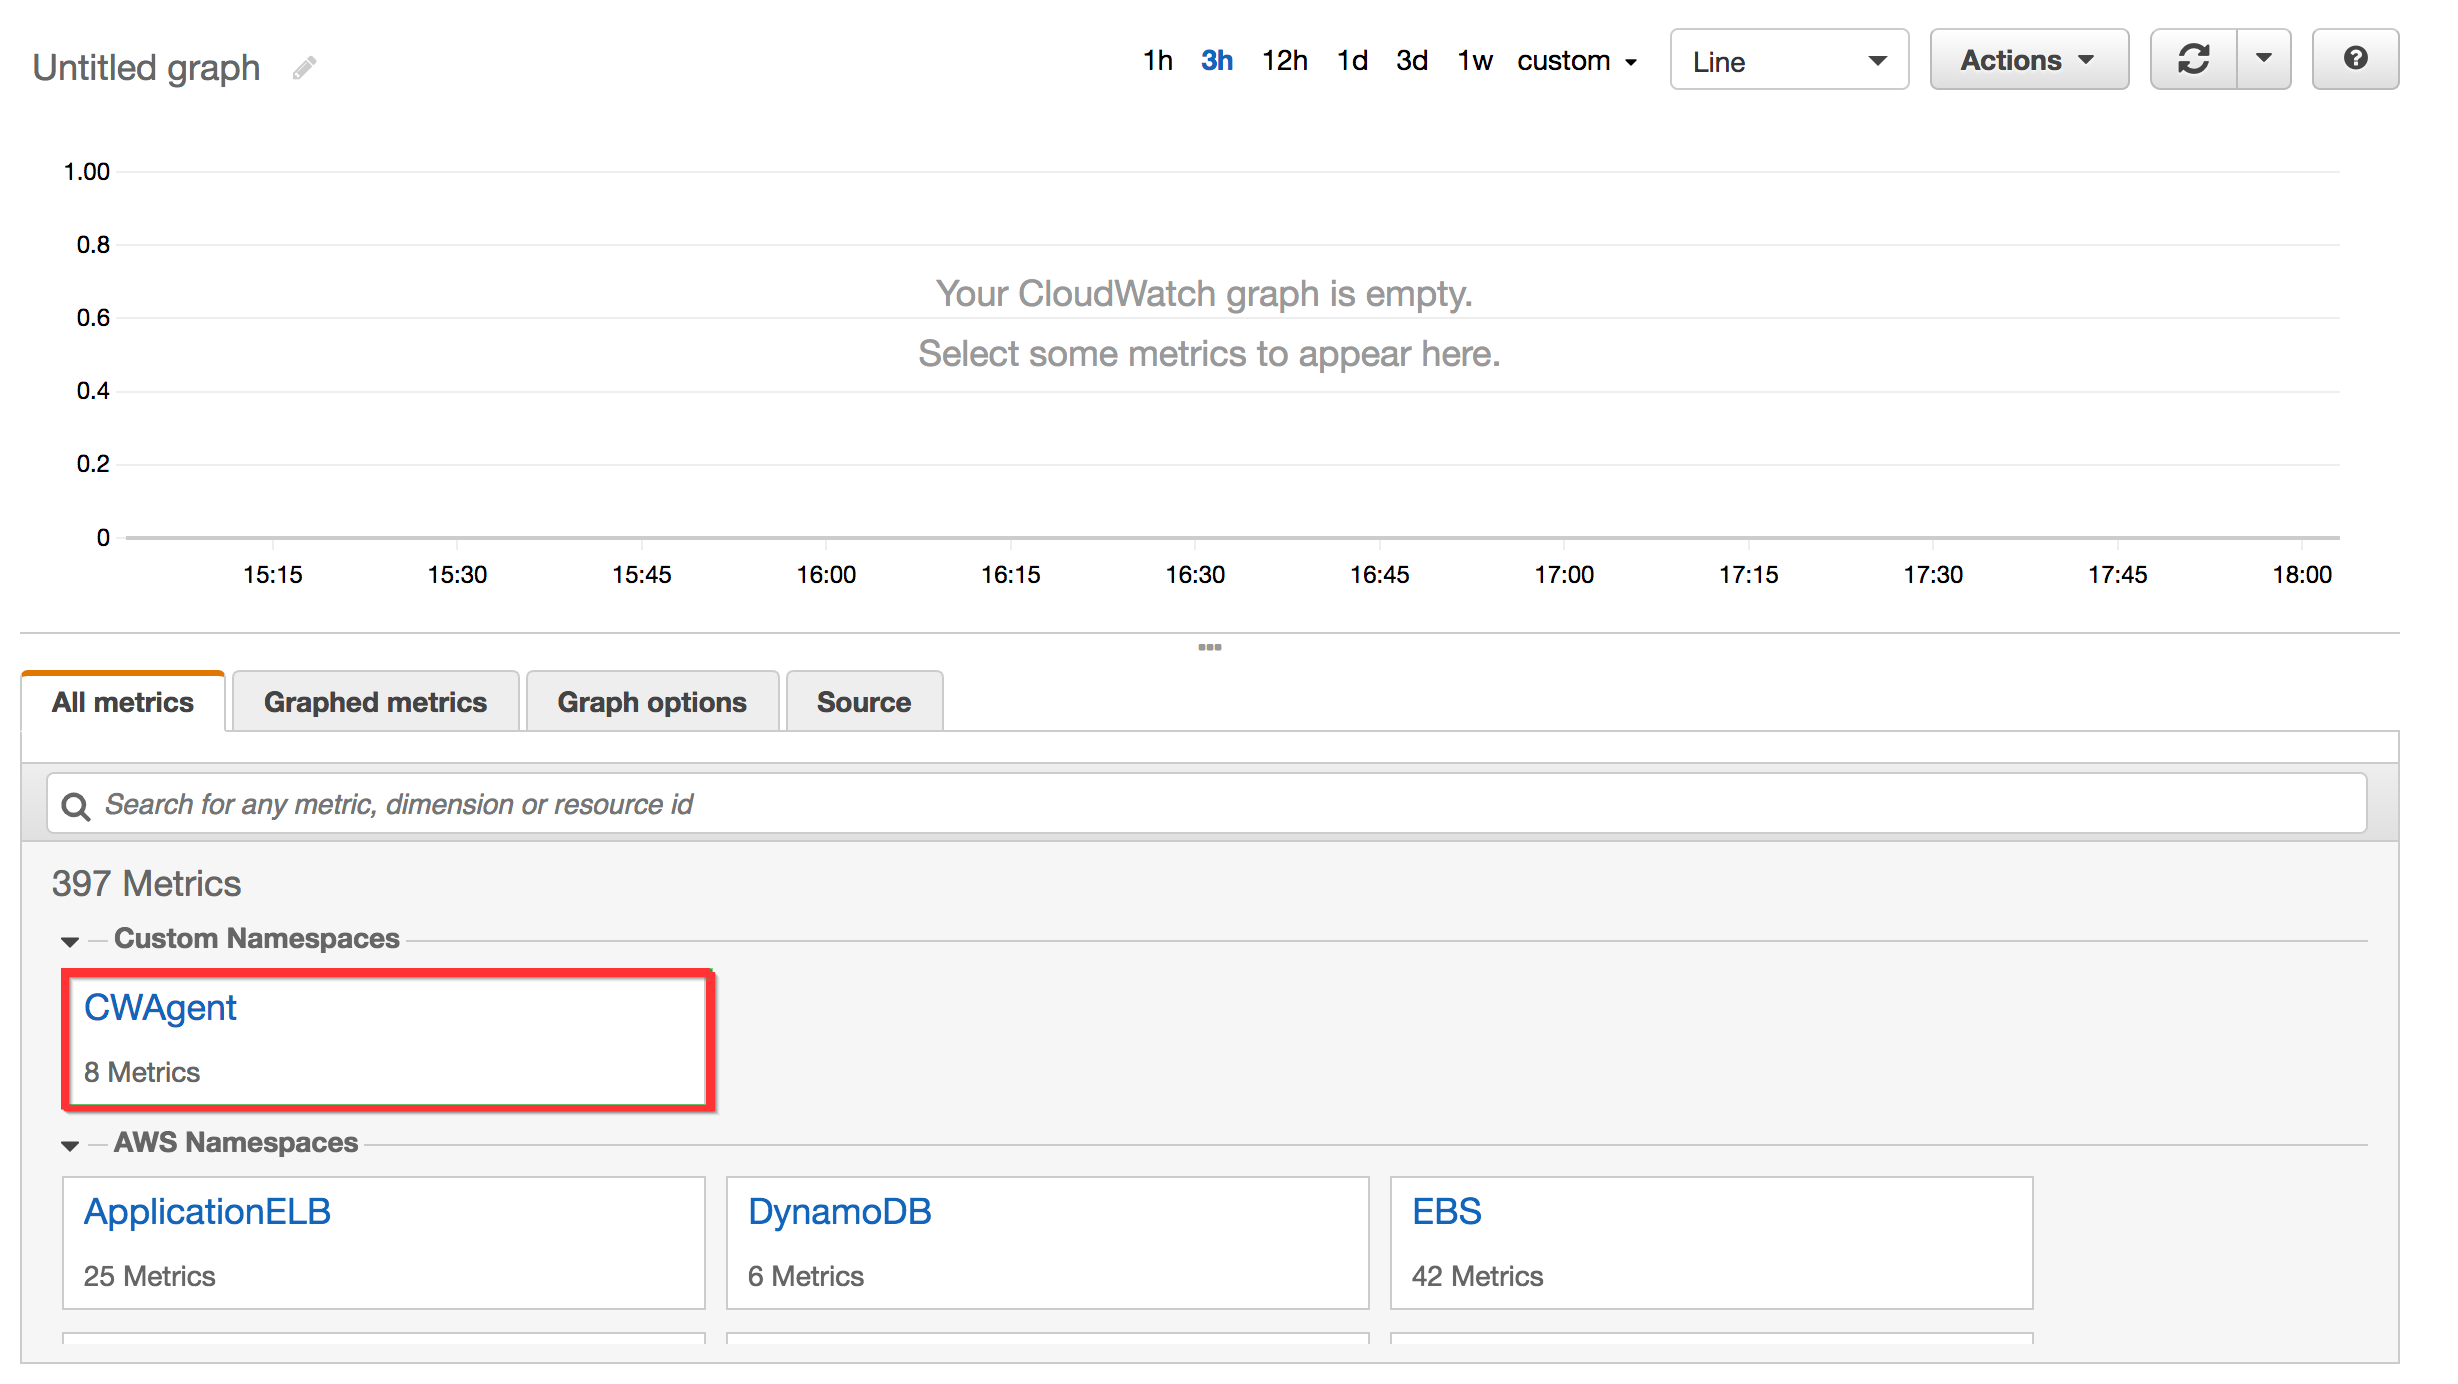 If you don't see the CWAgent namespace, AWS is currently not sending any memory metrics to CloudWatch.
 - Search the available metrics and click a metric for Instance ID that includes memory.
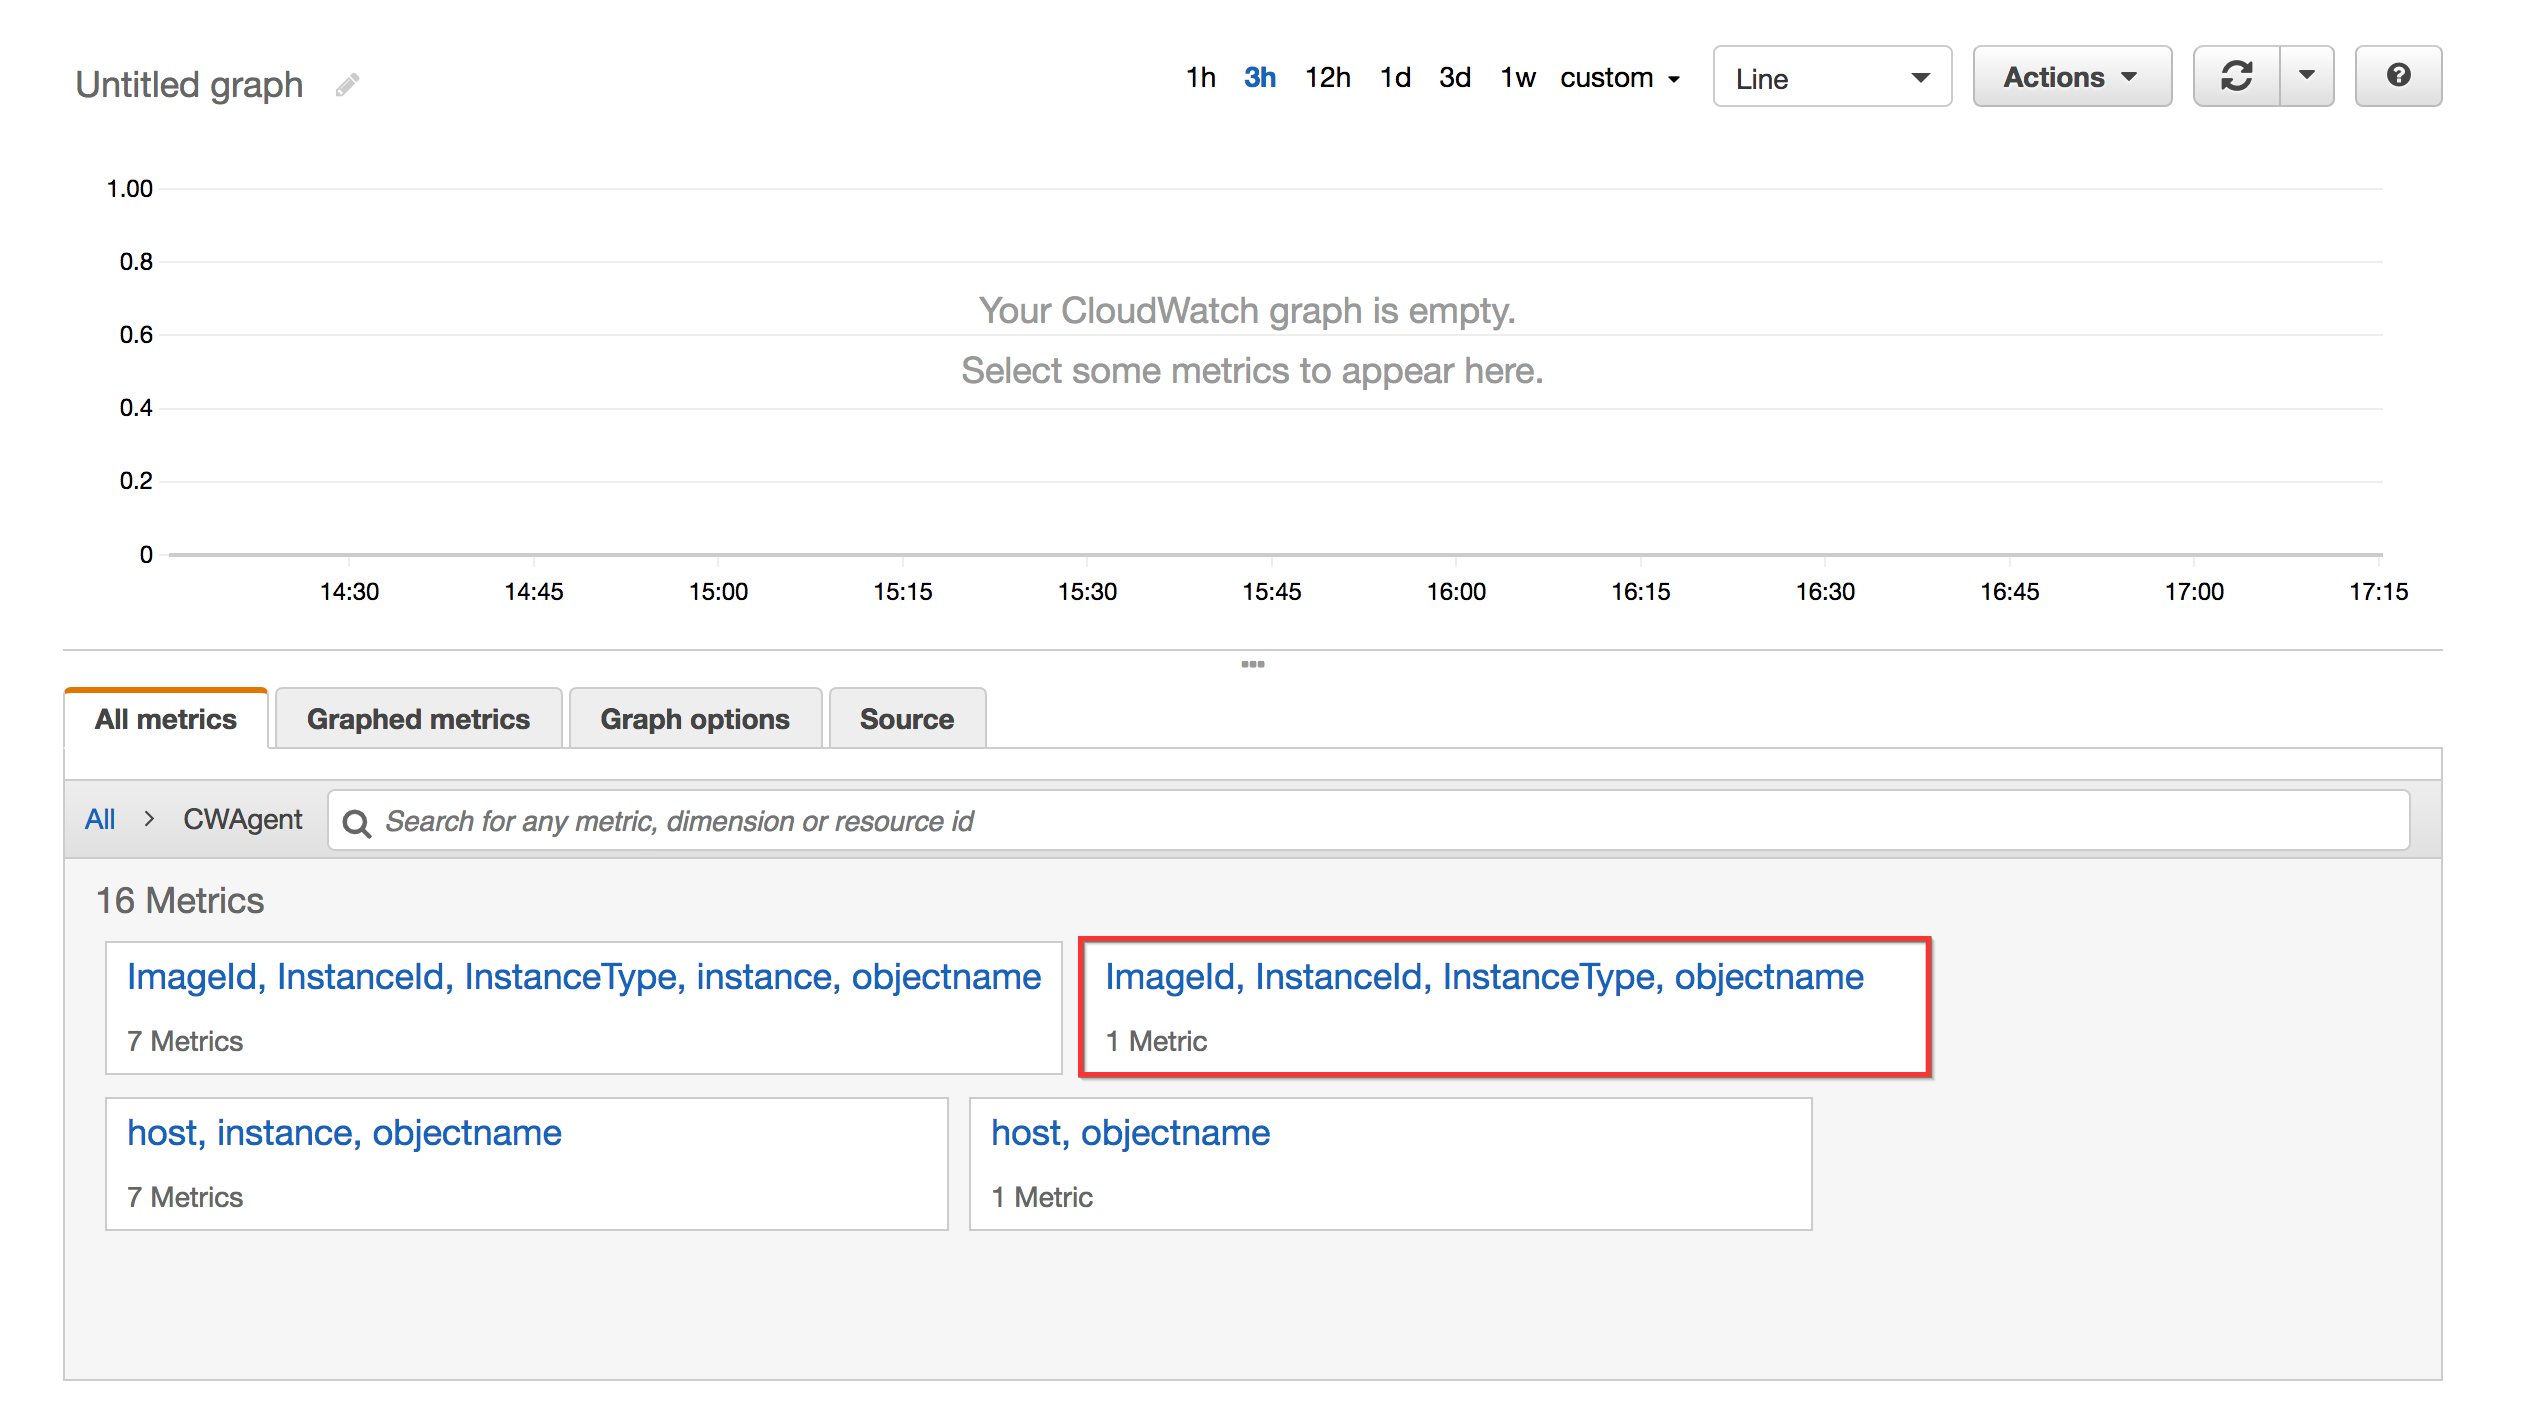
- From the All metrics tab, click the metric named Memory % Committed Bytes in Use.
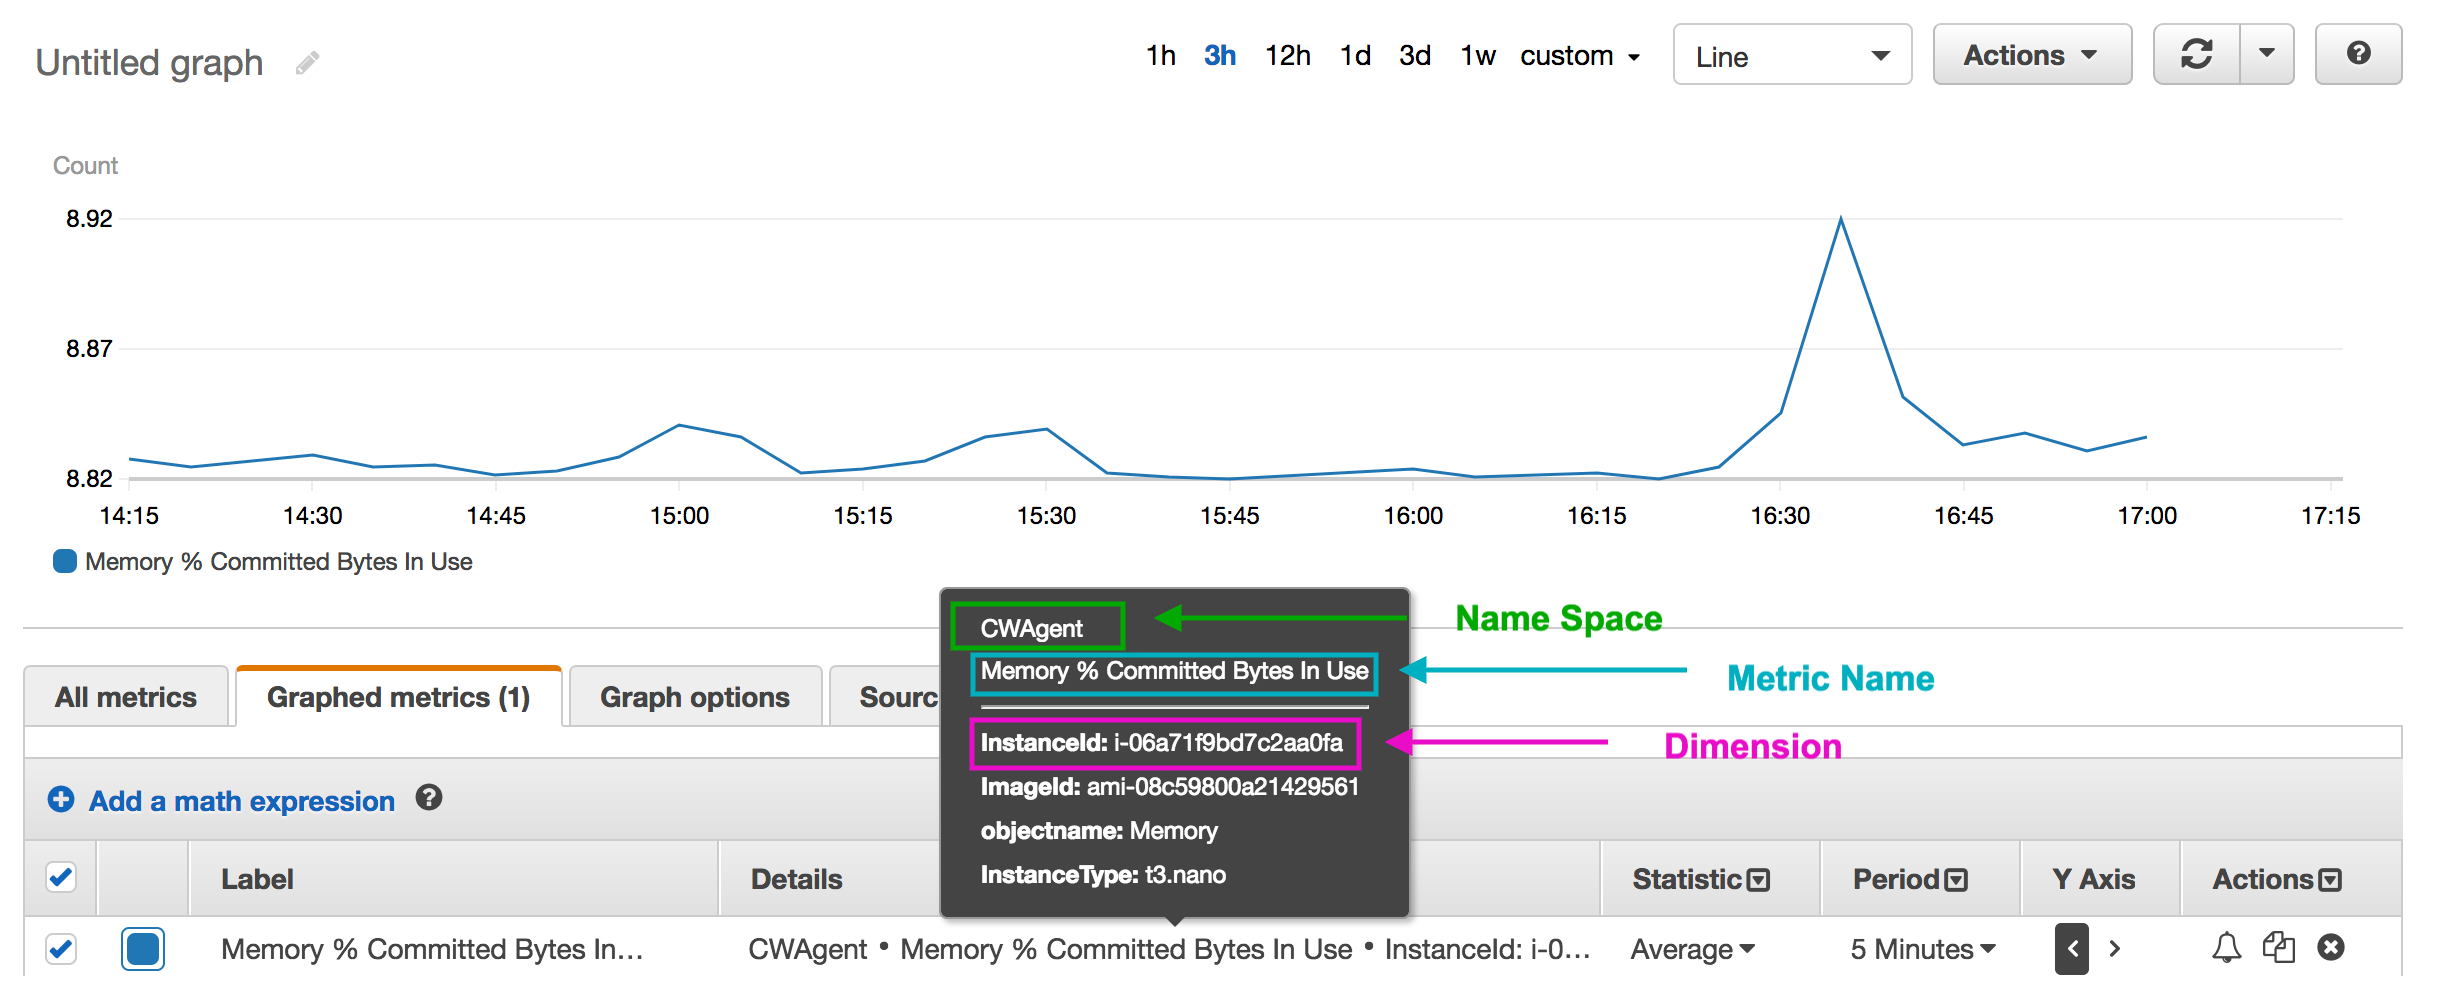
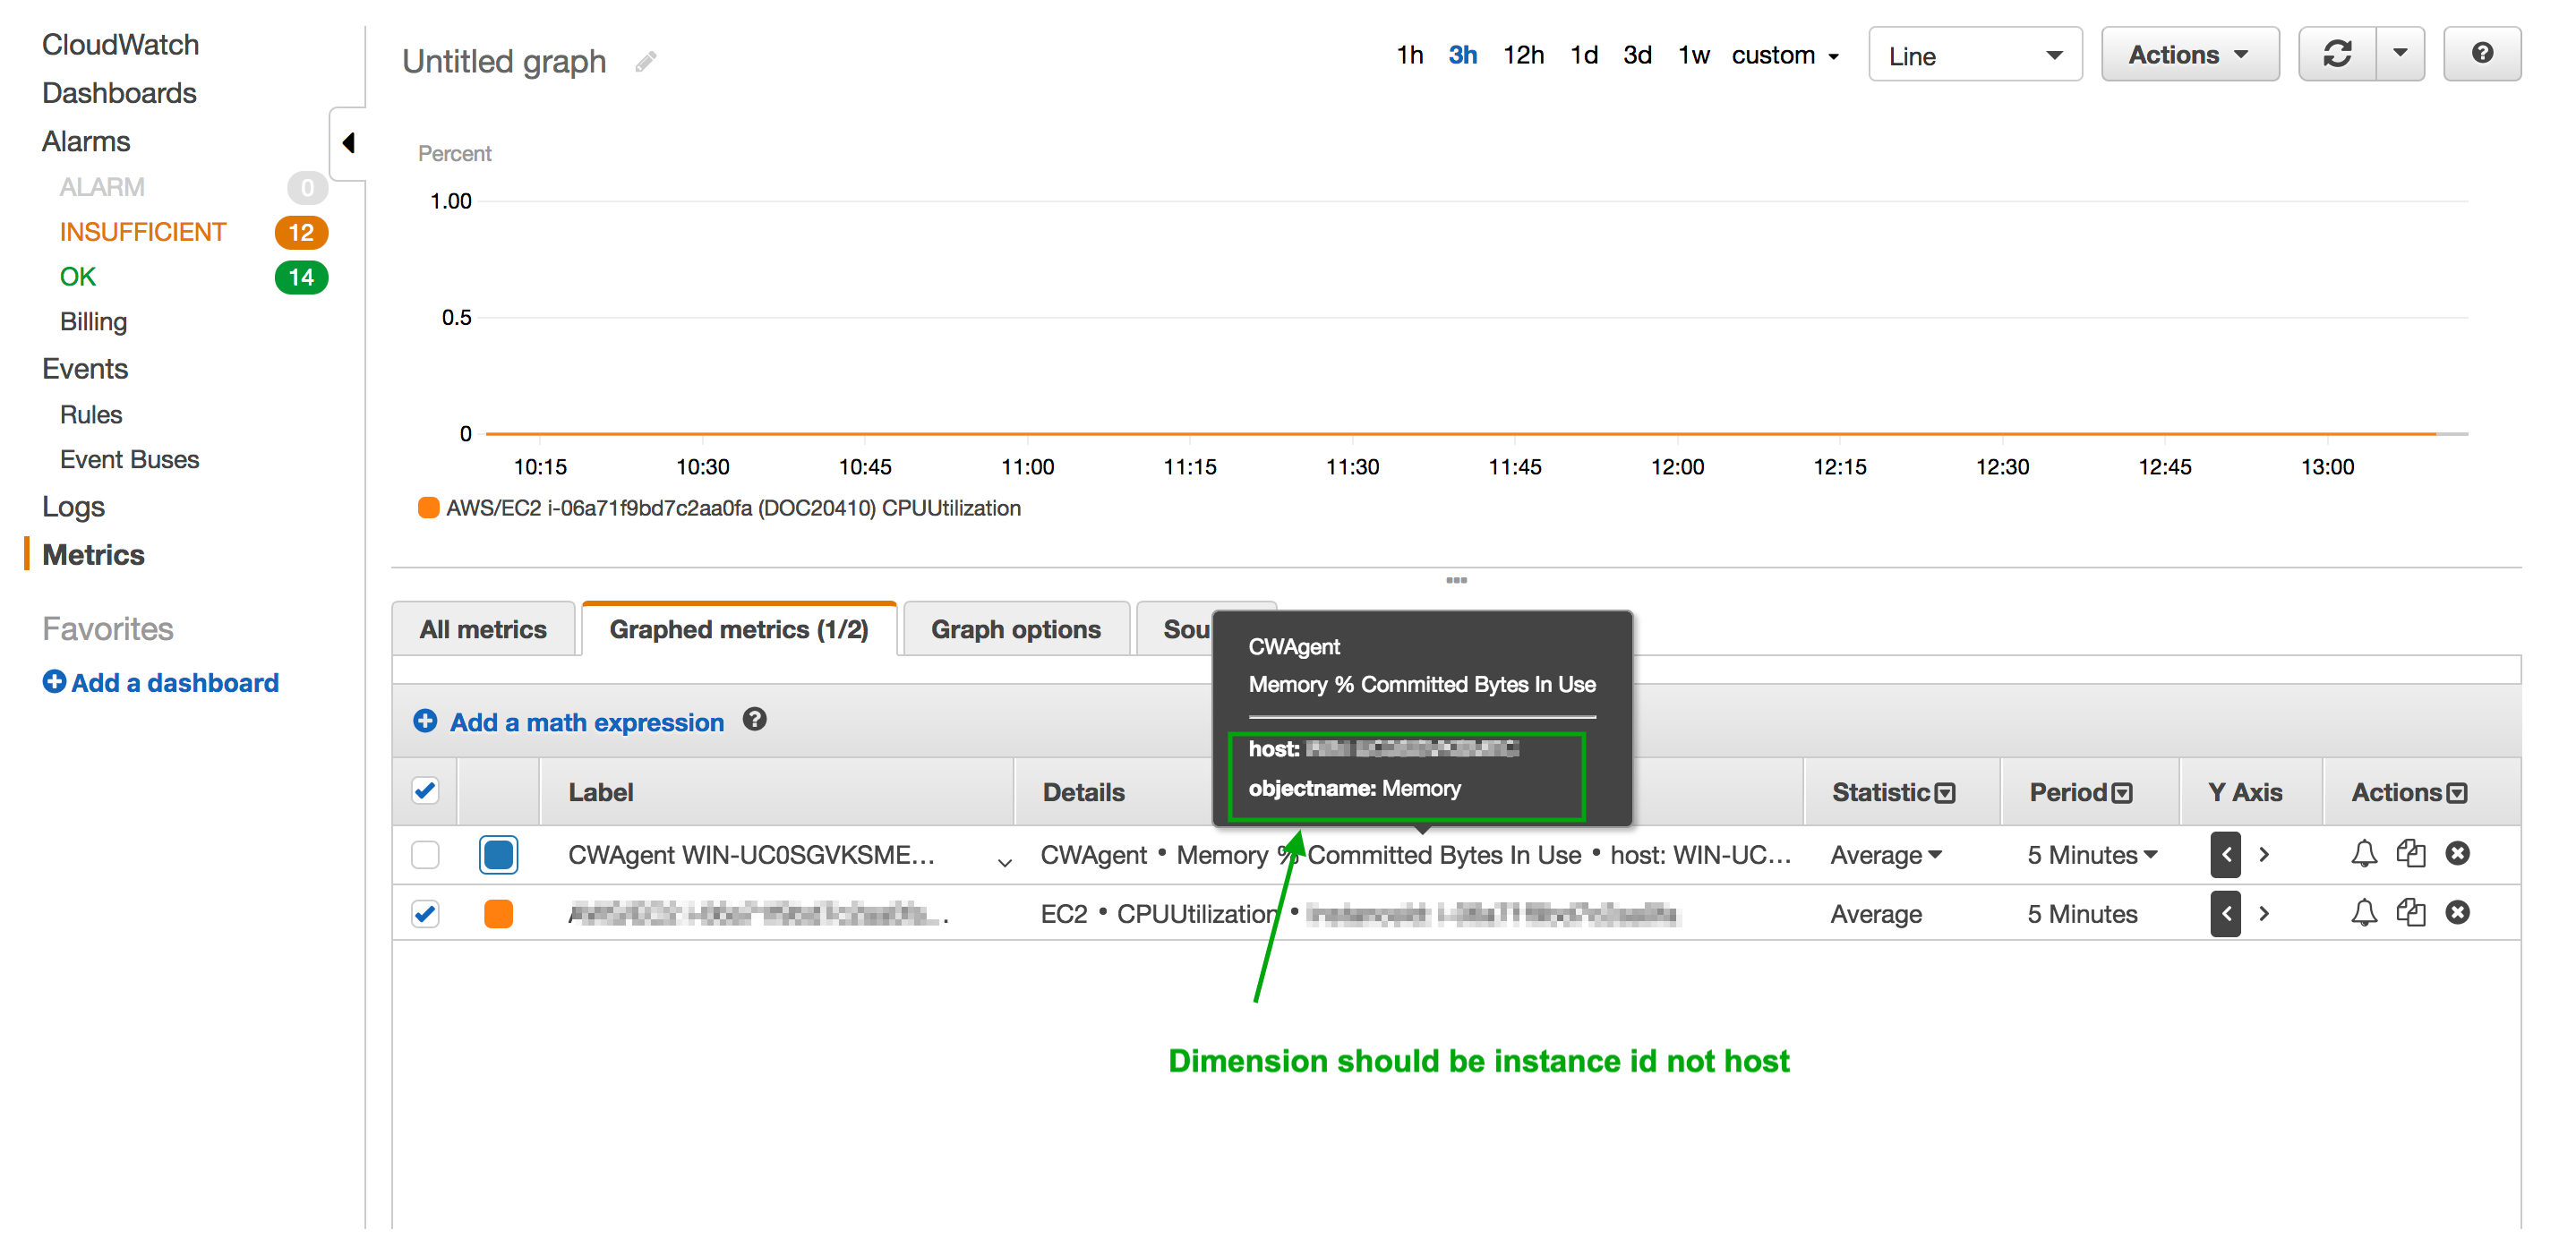
- Hover over the details to get the namespace, metric name, and dimension of the instance ID.
Write down these values and save them to a safe location.
- Launch CloudCheckr.
- From the left navigation pane, choose Utilization > Manage Custom Metrics.
The CloudWatch Custom Metrics page opens.
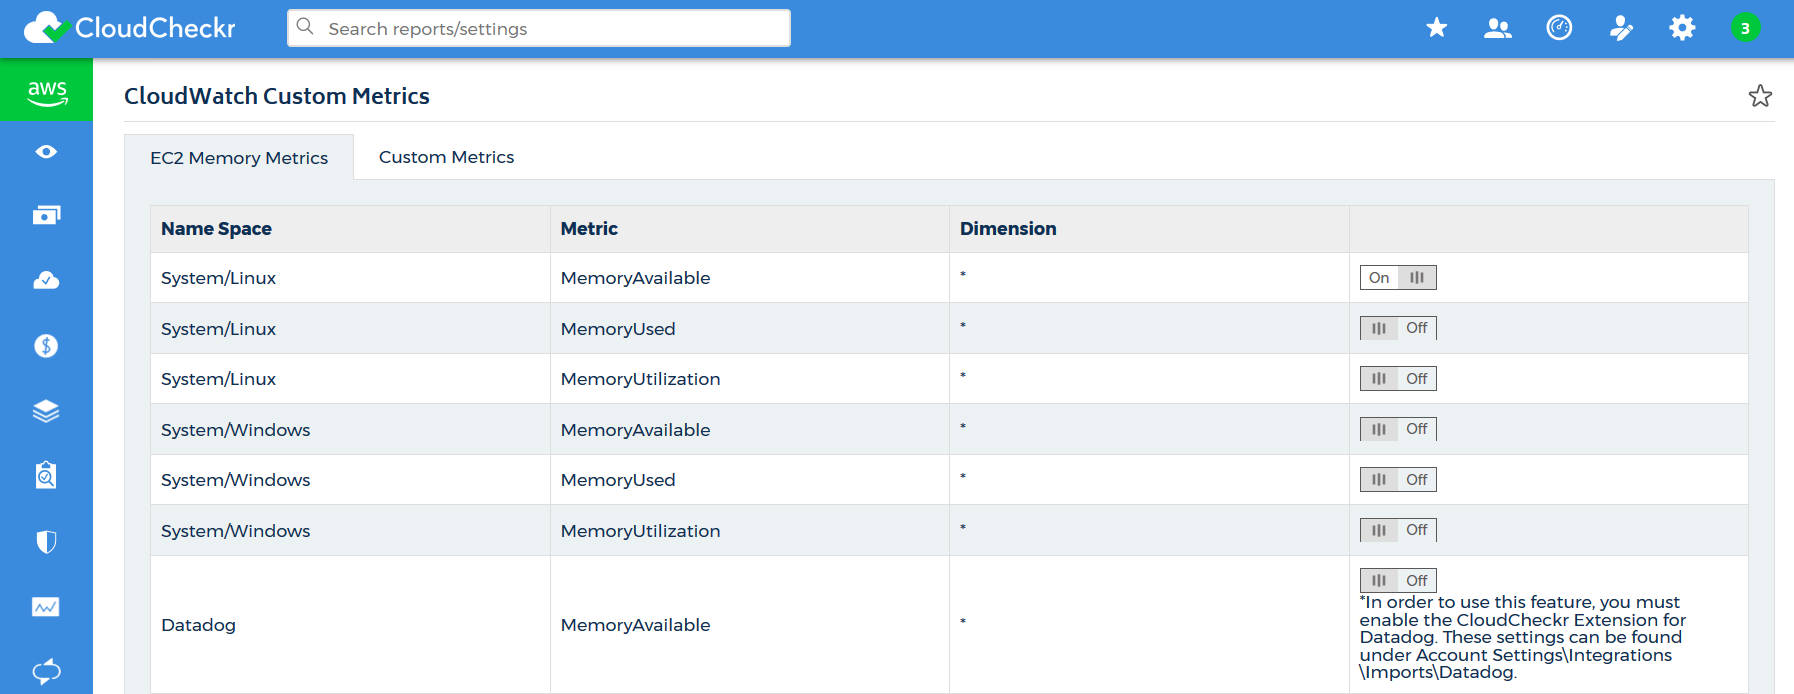
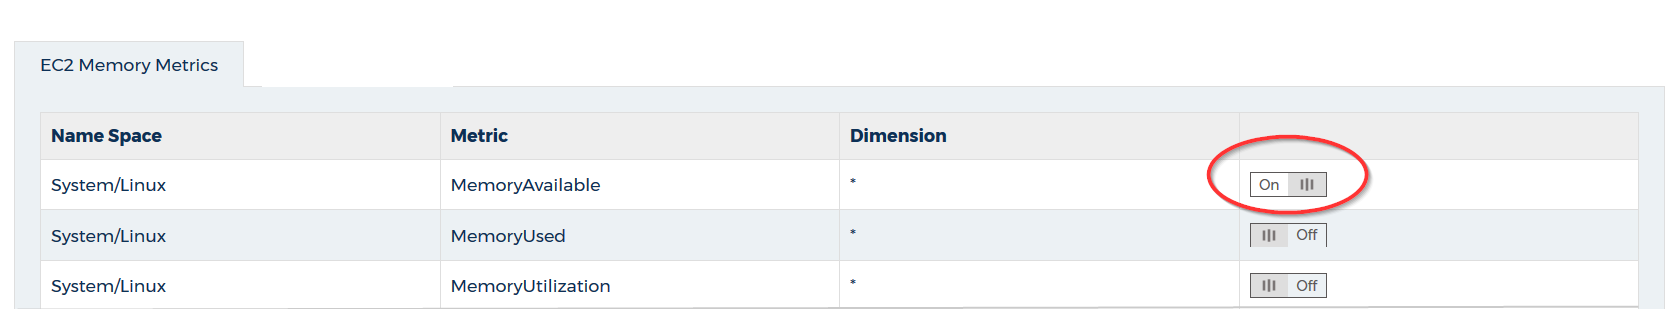
- In the EC2 Memory Metrics tab, move the toggle buttons to turn off any old namespaces that are currently on.
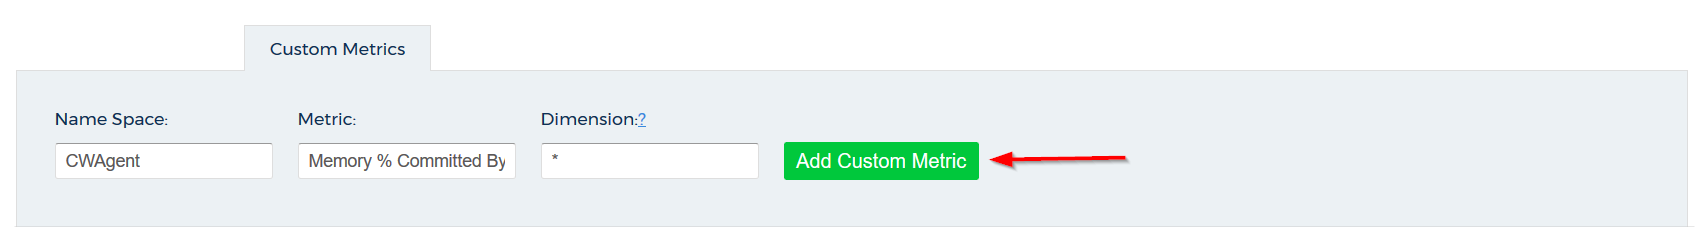
- Click the Custom Metrics tab.
- Define your new custom metric using the values you created in Step 8: Access Your CloudWatch Metrics:
- Type CWAgent in the Name Space text field.
- Type Memory % Committed Bytes In Use in the Metric text field.
- Type * in the Dimension text field to indicate that you want to collect all dimensions.
- Click Add Custom Metric.
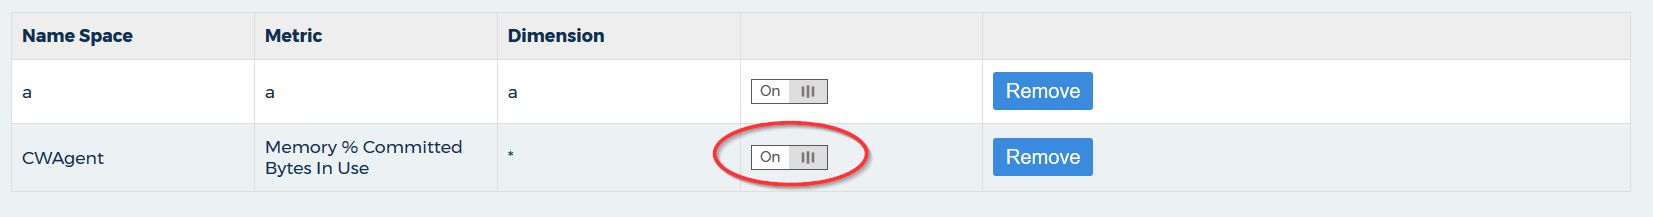
- Verify that your custom metric is turned on.
- Allow enough time to pass so that the back-end jobs can run CloudWatch Collector and report on the memory metrics.
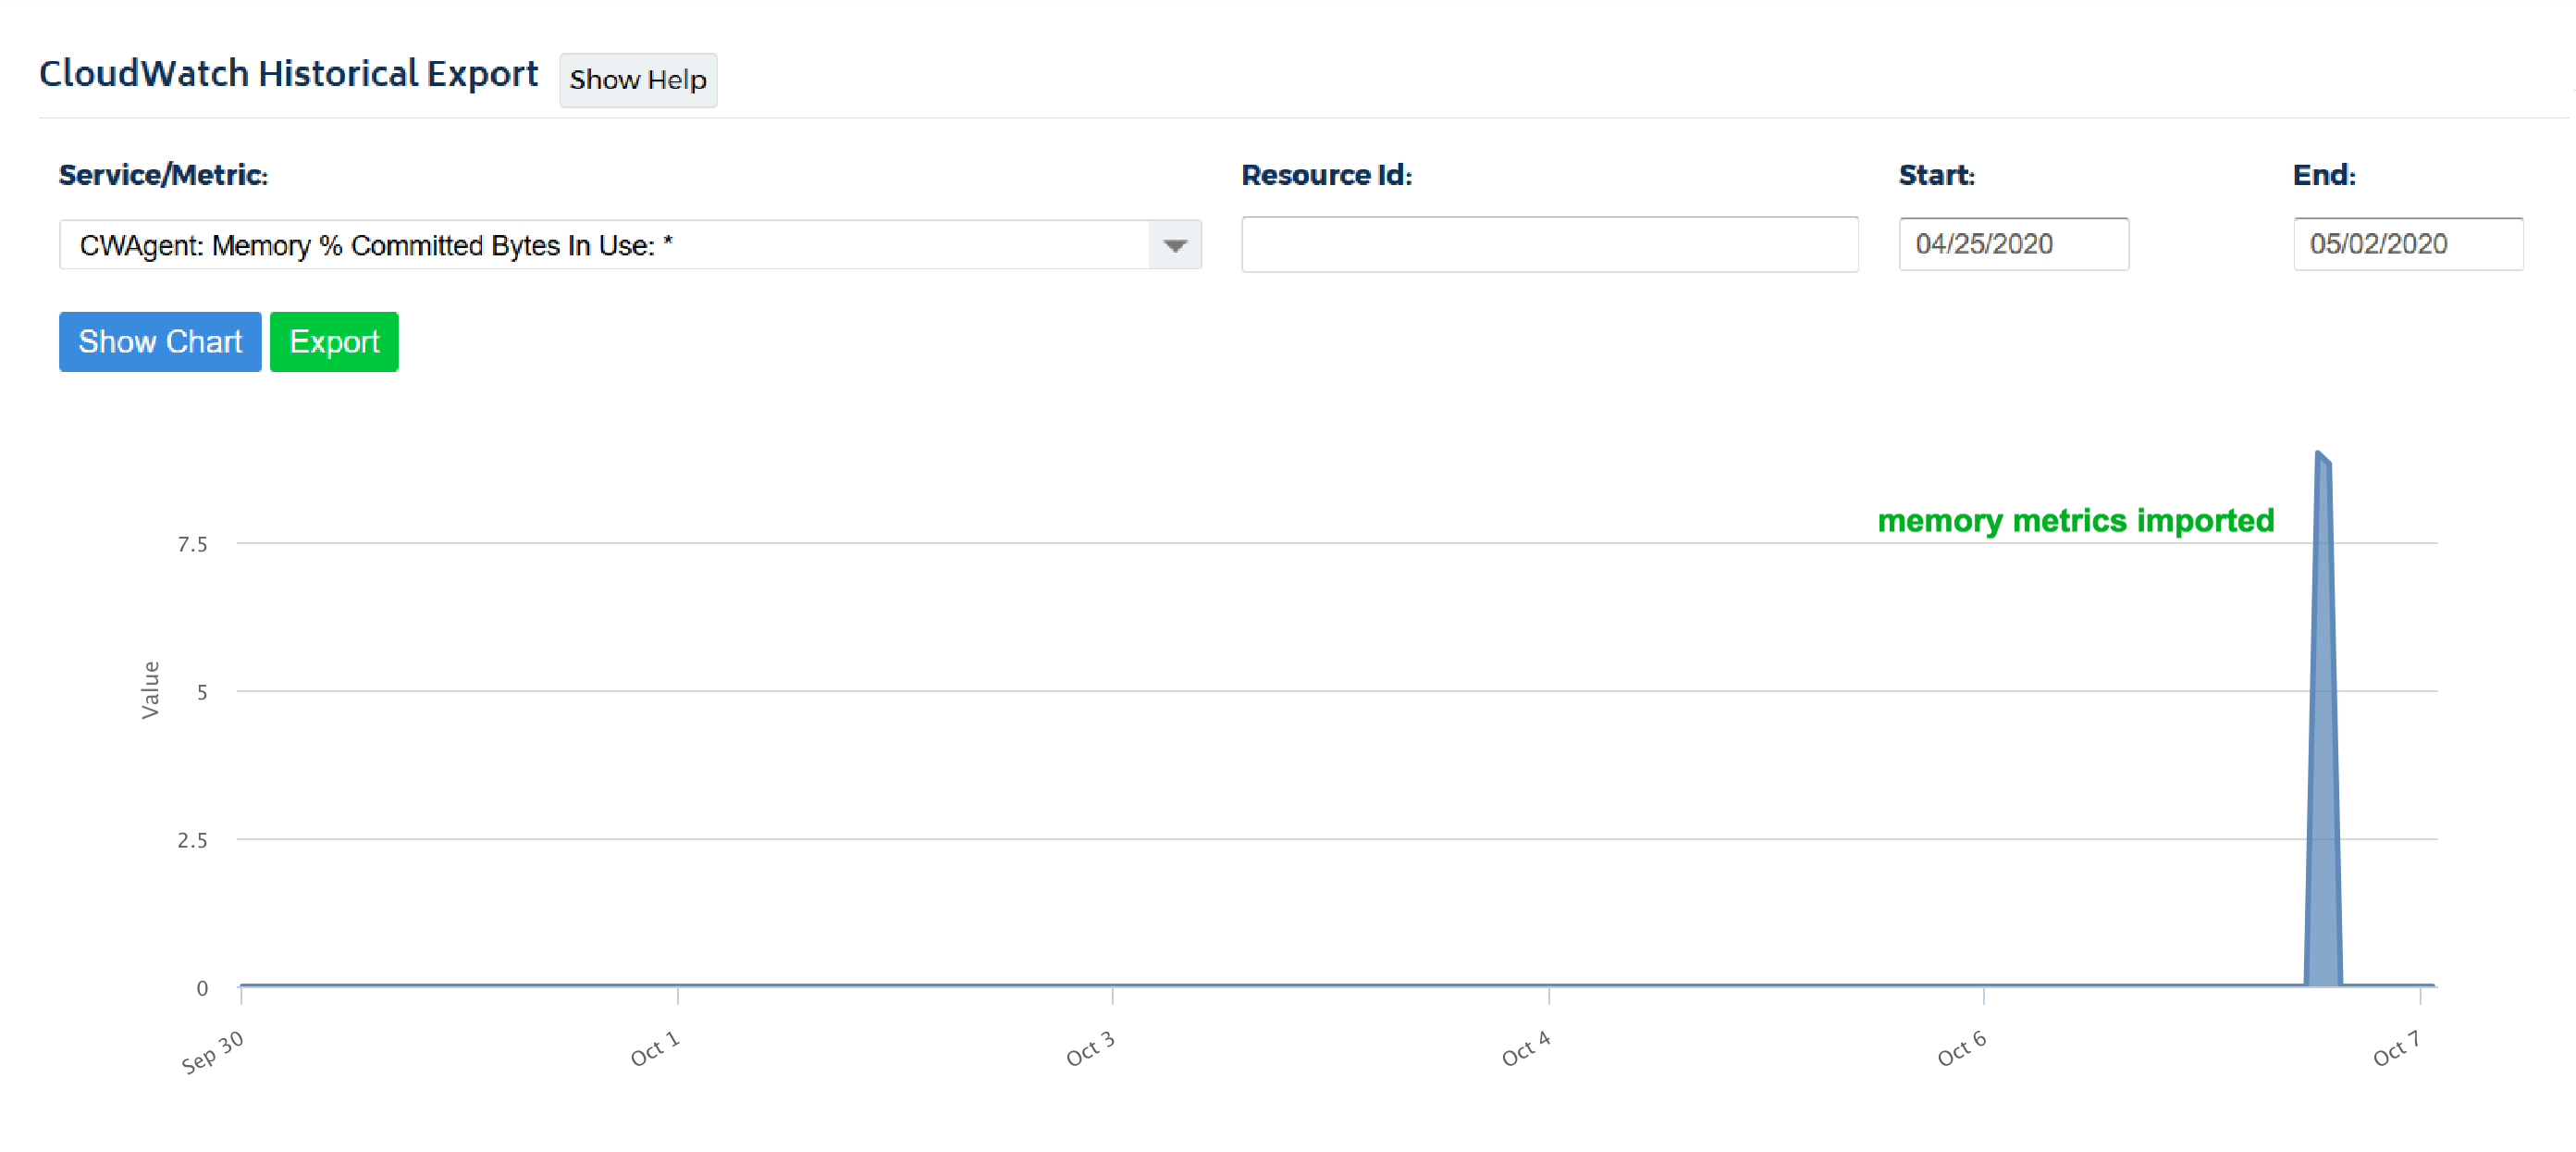
- From the left navigation pane, choose Utilization > CloudWatch Historical Export to view the CloudWatch data.
Here is an example of how CloudCheckr will display the imported CloudWatch memory metrics data:
Troubleshooting
Review these troubleshooting tips if you are having problems with your CloudWatch setup:
Make sure that you specify the location of the SSM parameter store name, which is the name you selected in Step 5d in the Step 7: Run the CloudWatch Manage Agent procedure:
If you have not run the wizard, RDP in to the instance and run the wizard.
Make sure that:
- the AWS account with the EC2 instance where the CloudWatch Agent is installed has CloudCheckr credentials
- these credentials allow for all read EC2 and read CloudWatch permissions
- CloudCheckr has run the Discovery job
CloudCheckr reports these metrics by default when an EC2 instance is running. Make sure that CloudCheckr has had sufficient time to report on these metrics.
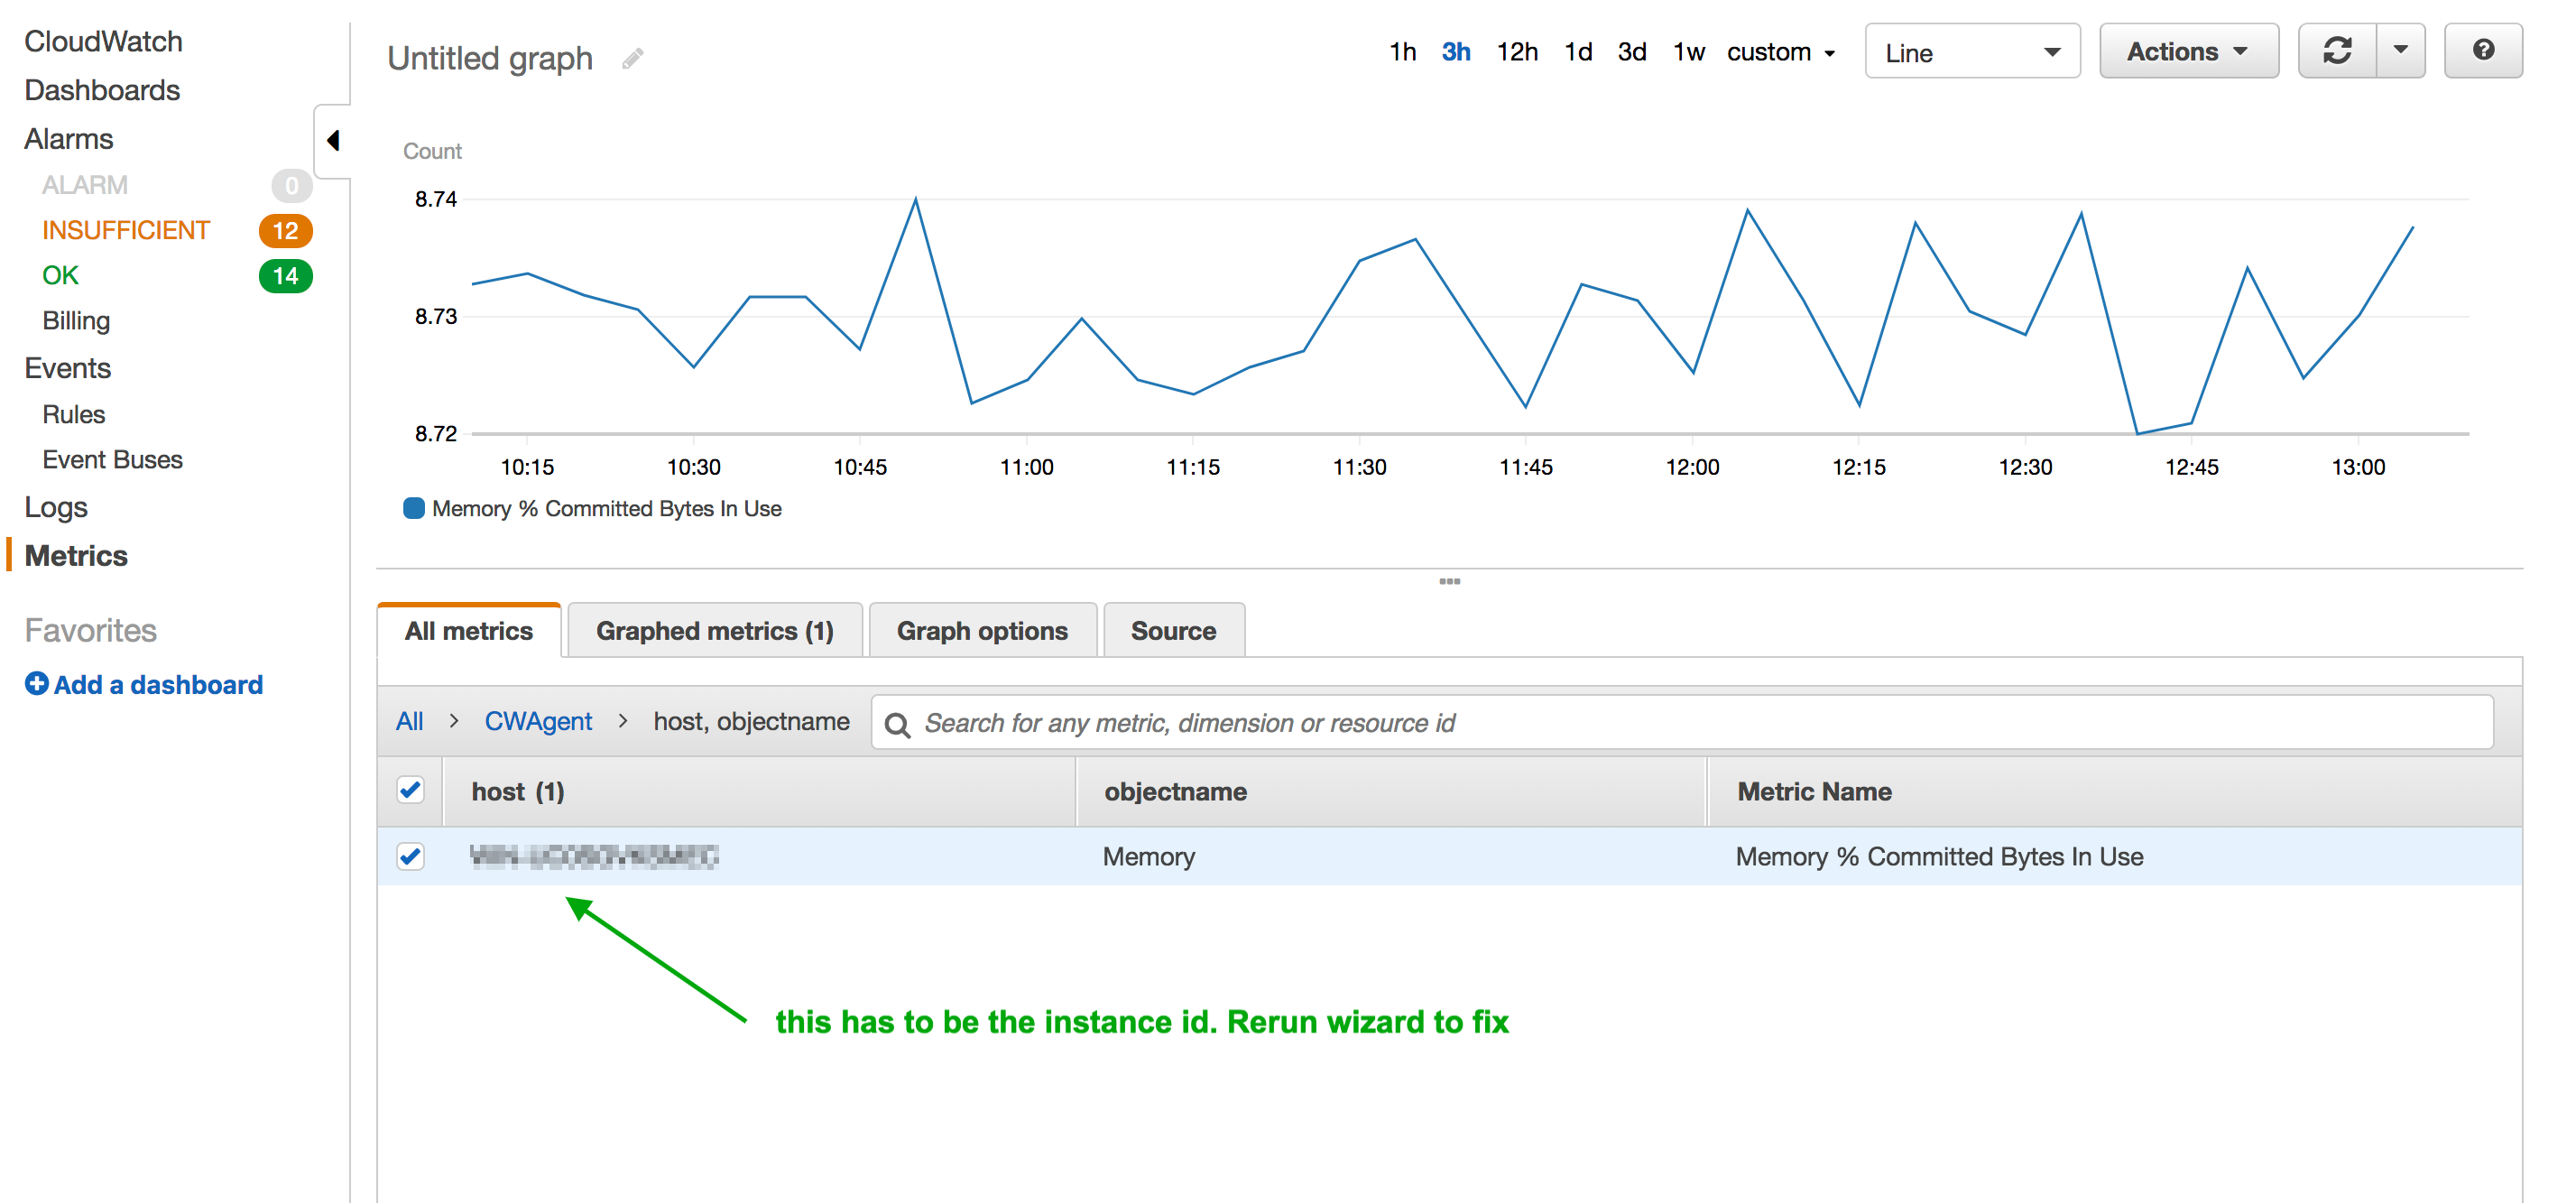
If you don't see any metrics in the AWS Console, then your EC2 instance isn't delivering memory metrics to CloudWatch. Checks the following:
- Is a role with the required permissions attached to the EC2 instance?
- Is the CloudWatch agent installed and running?
- Is the role attempting to pull metric data from CloudTrail?
You may also have to re-run the SSM commands for the CloudWatch Agent installation, re-run the configuration wizard, and re-start the agent.
You may have to:
- re-run the configuration wizard to set the dimension to be the Instance ID
- name the parameter store name with a new name
- re-run the SSM commands
for running the CW Agent to specify the new parameter store name that you saved with the wizard
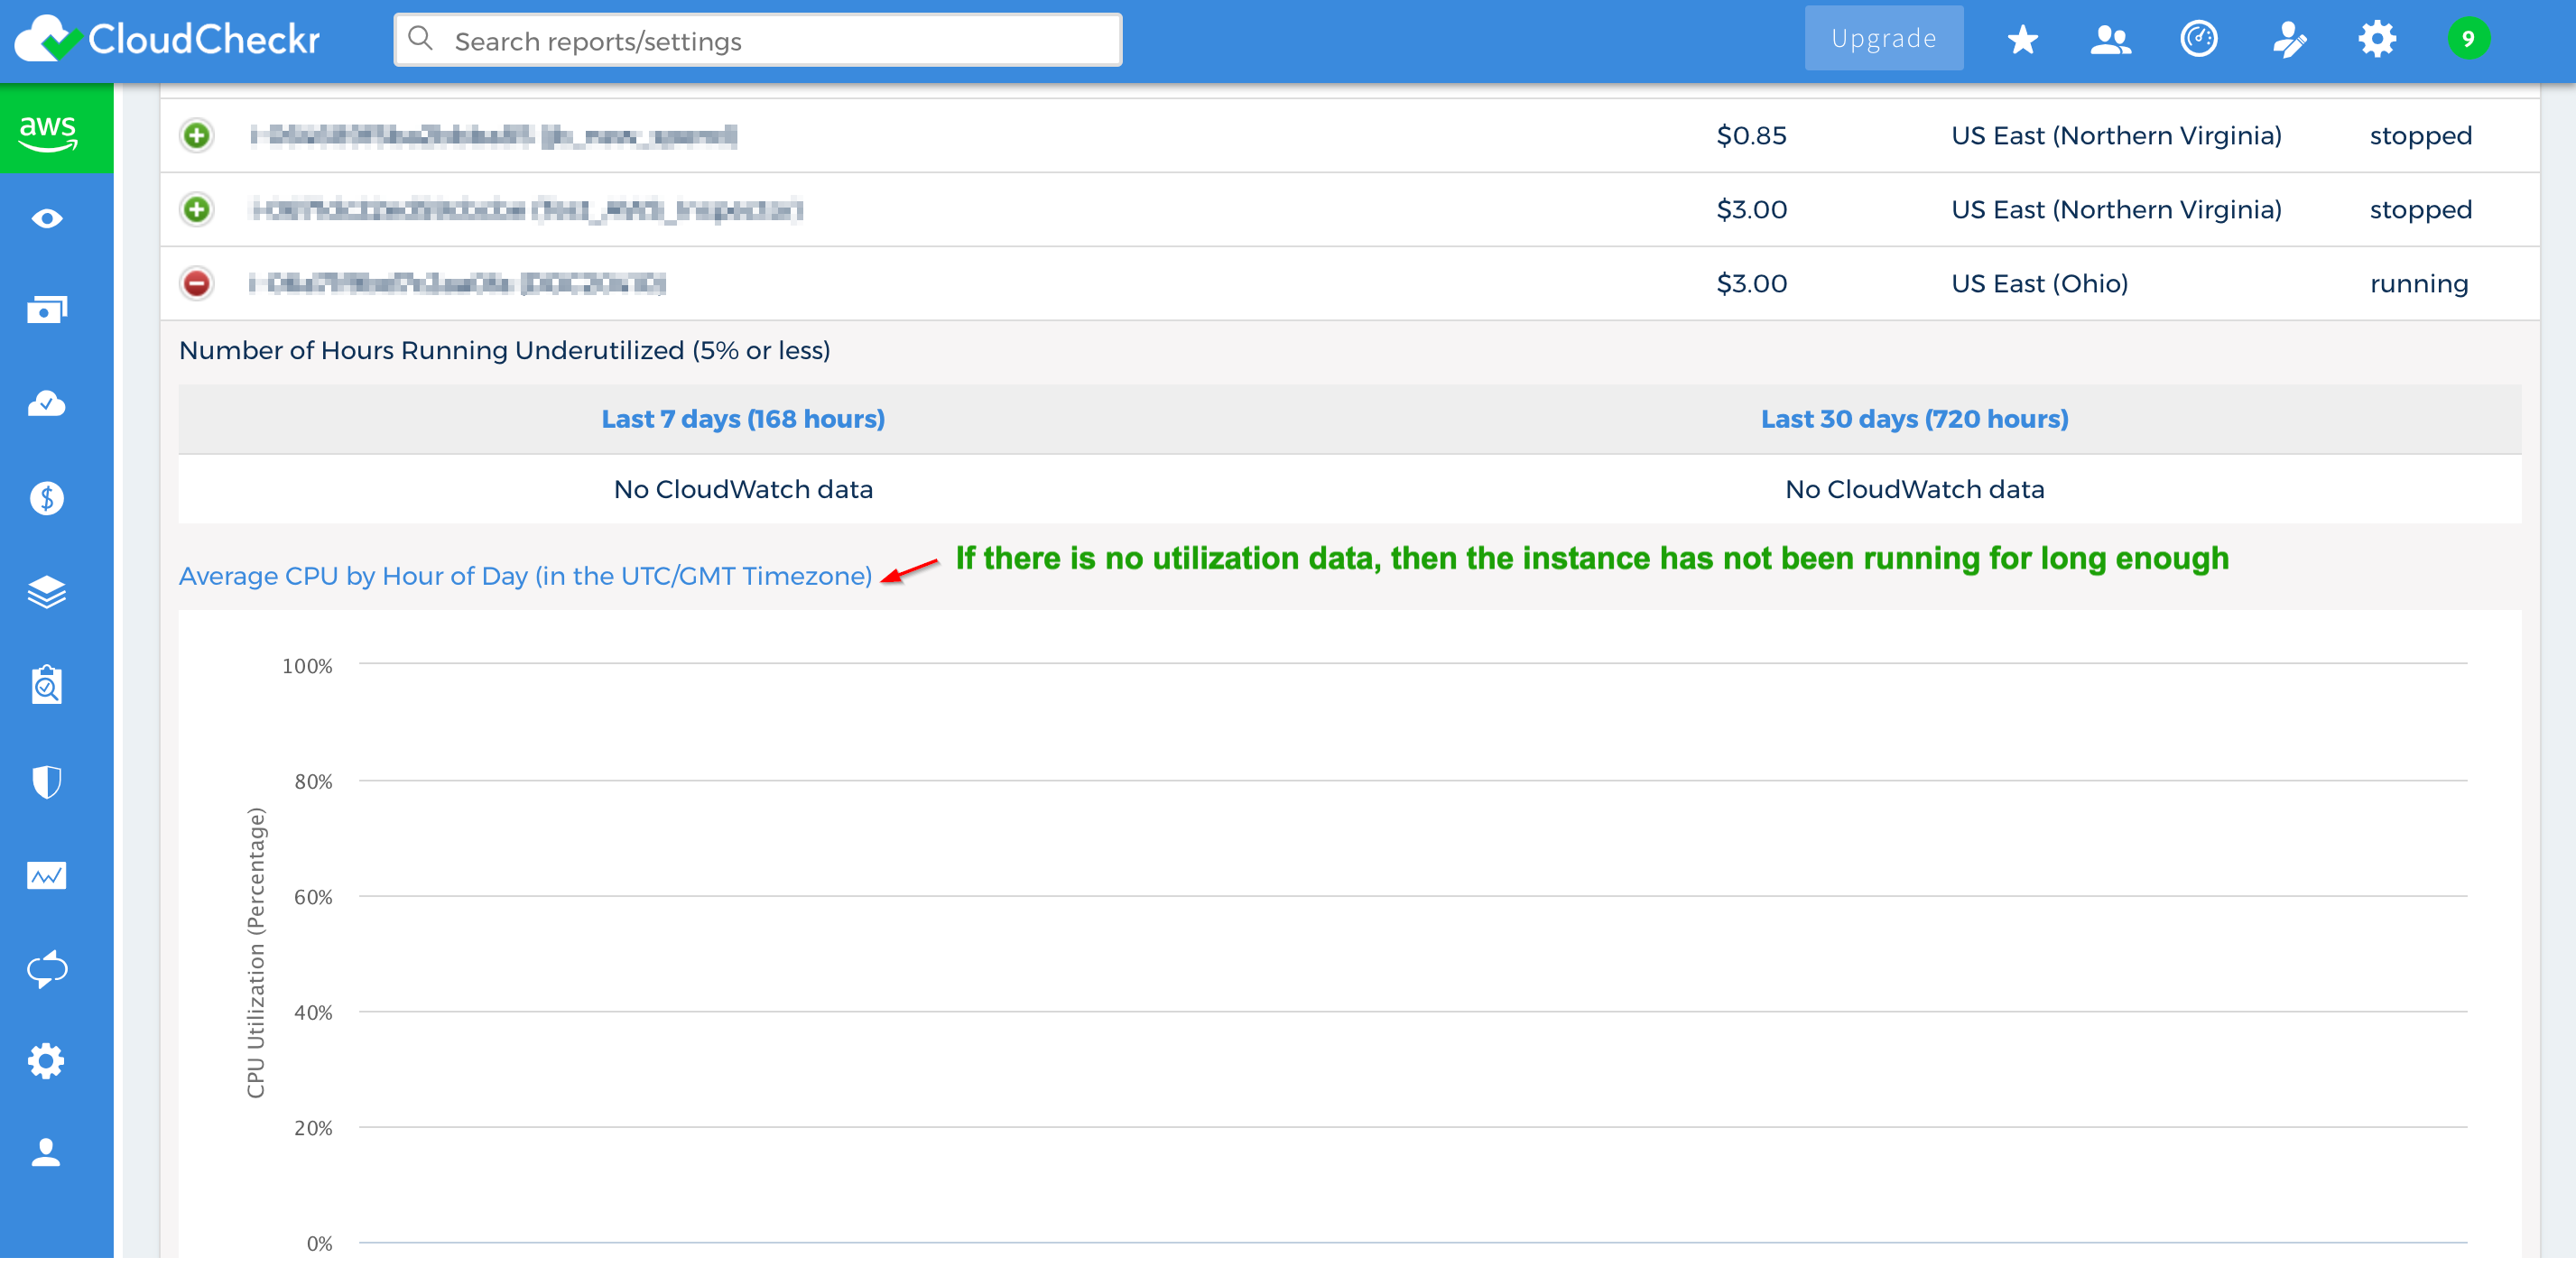
Good news. This means the instance is the correct size. No further action is needed on your part.
CloudCheckr requires several days of memory metric data before it can report on memory metrics for this page. It takes the average of the last thirty days. Continue to wait and CloudCheckr will eventually populate those metrics.
Sometimes, the default configuration doesn't write the metrics with the dimension of Instance ID, which is required for successful CloudWatch Agent setup.