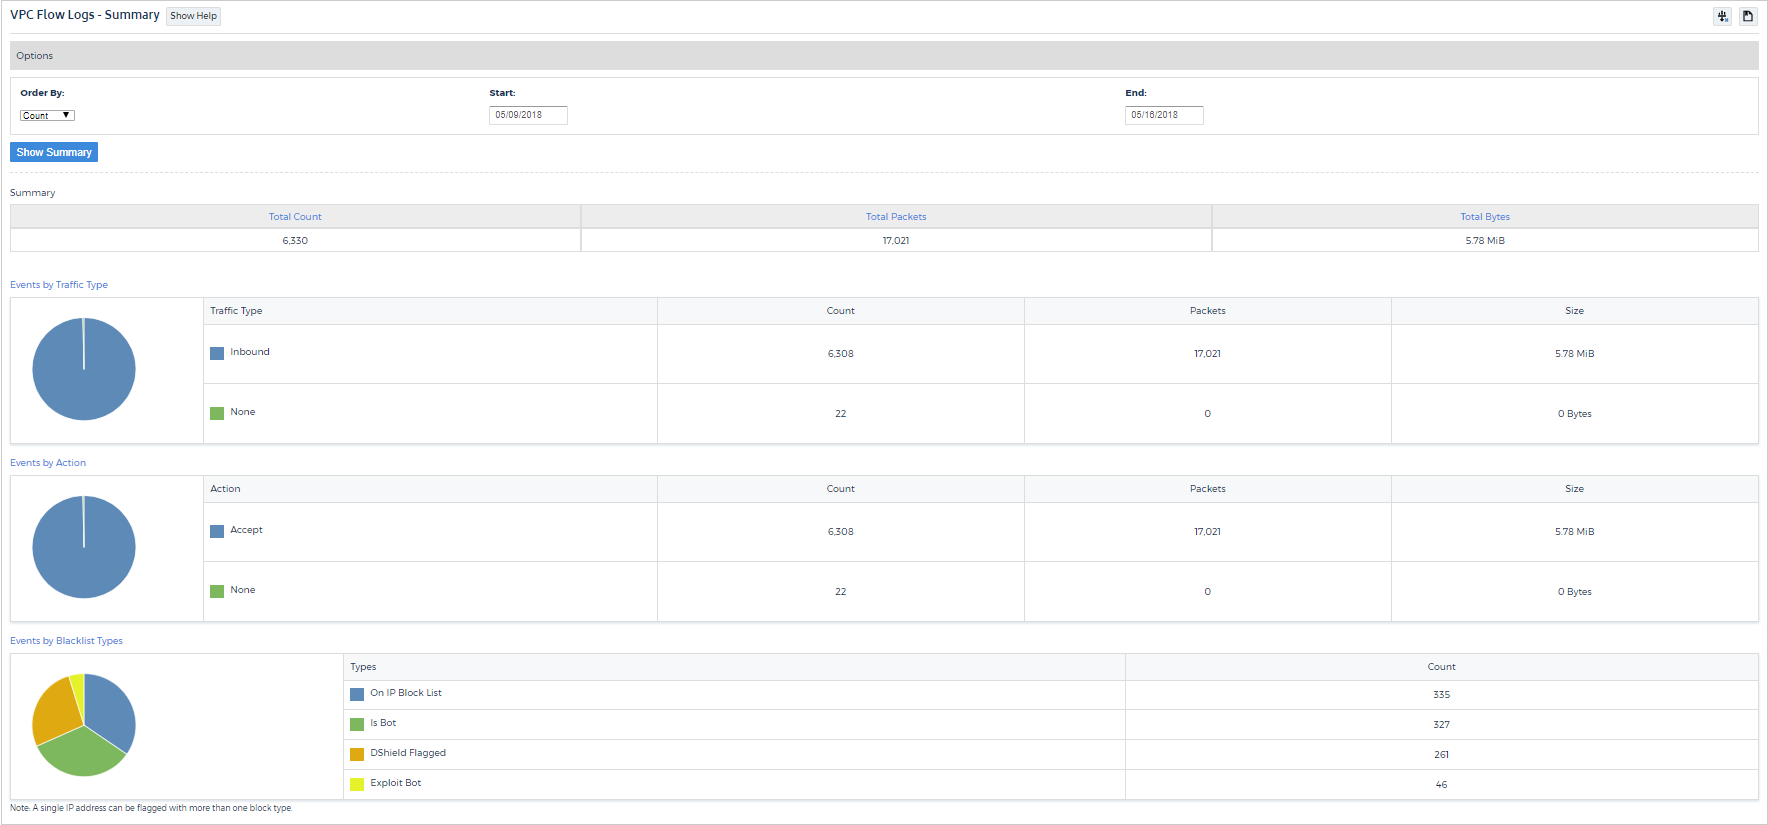
This report is a snapshot of the virtual private cloud (VPC) flow log data that CloudCheckr imports from AWS.
VPC flow logs capture information about the IP traffic going to and from network interfaces within your VPC.
In this report, you can specify the date range of the VPC flow log data that you want to view and order the results by count, packets, or bytes.
This report also categorizes the data by traffic type, action, and blacklist types.
Review the AWS topic,
VPC Flow Logs, for more information.
Procedure
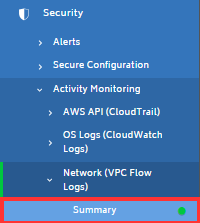
From the left navigation pane, choose Security > Activity Monitoring > Network (VPC Flow Logs) > Summary.
The VPC Flow Logs – Summary page opens.
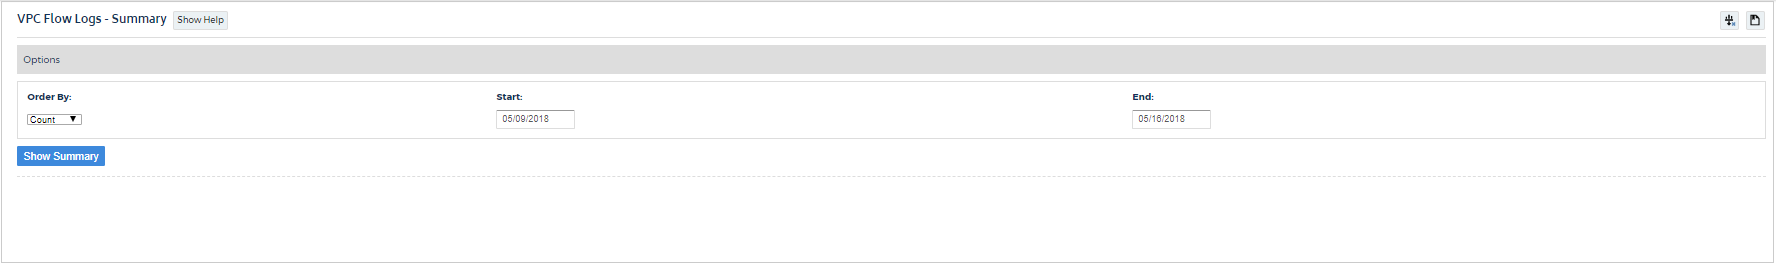
In its default state, no information is displayed until you select the options that you wish to filter your data on.
From the Order By drop-down menu, select if you want to categorize your data by counts, packets, or bytes.
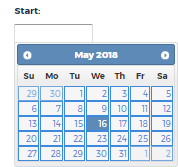
In the Start text field, click to display the calendar and use the arrow buttons to select a date.
In the End text field, click to display the calendar and use the arrow buttons to select date.
You can also type a Start and End date in MM/DD/YYYY format.
Click Show Summary.
The page populates with data according to the criteria you selected.
The Summary section shows the total count, packets, and bytes.
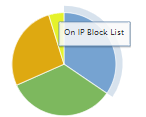
Events are categorized by traffic type, action, and blacklist types.
Hover over a section of the pie chart to see what event it corresponds to.