Custom Reports enables you to create custom inventory reports using a Custom Report Builder. The procedure walks you through an example of how to create a custom report.
Procedure
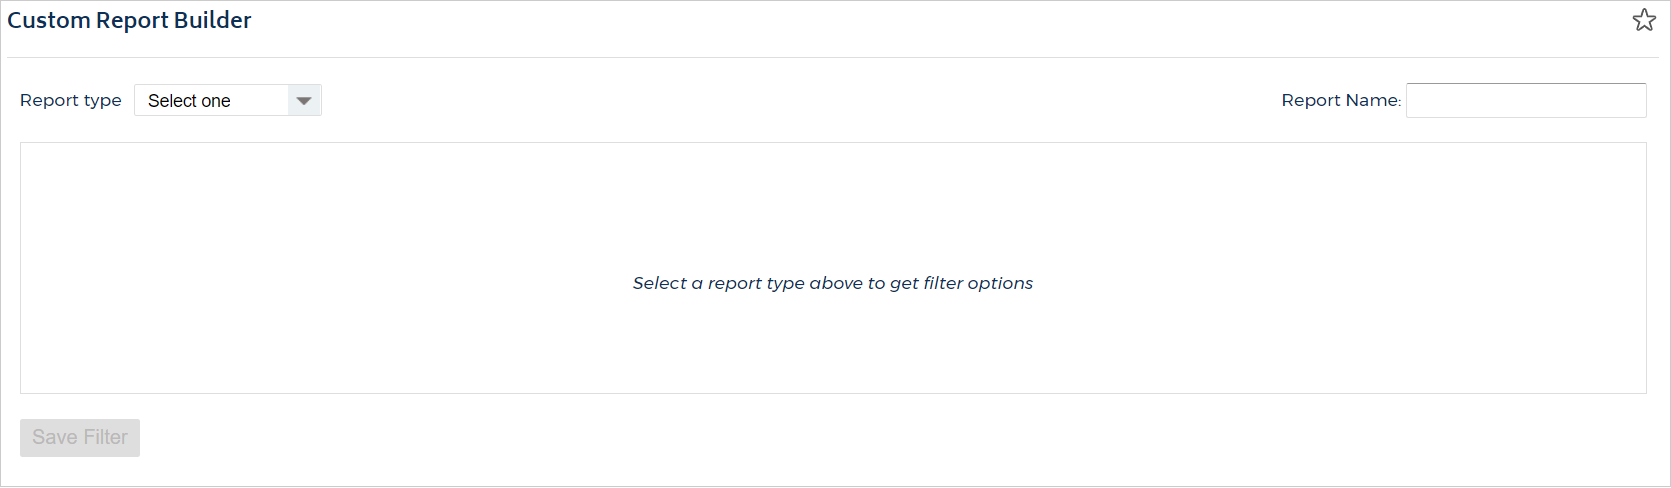
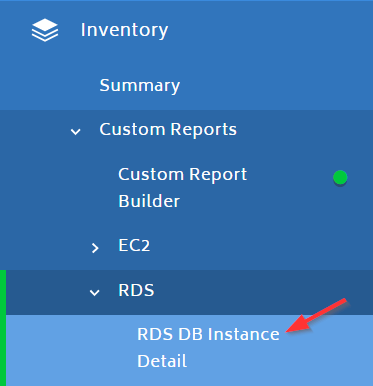
From the left navigation pane, choose Inventory > Custom Reports > Custom Report Builder.
The Custom Report Builder page opens.
From the Report type drop-down menu, select a report type.
CloudCheckr will populate the Filter, Columns, and Sort By options based on this selection.
For this procedure, we selected RDS.
In the Report Name text field, type a name for your report. You must provide a name before CloudCheckr can save your report.
Click
(Add new filter).
In the first drop-down menu, select the type of data on which to filter your report.
In the second drop-down menu, select a function to refine your search.
Function
Description
Example
is equal to
finds exact matches
Instance Status is equal to Running: finds all of your running EC2 instances
is not equal to
finds everything except this exact match
Region is not equal to EU (Ireland): finds all resources not in that region
contains
finds resources that contain your selection, and may include partial matches
Tag contains Product: finds all resources tagged with Key = Product
does not contain
finds resources that do not contain your selection and may include partial matches
Availability Zone does not contain 1c: finds all resources in the other availability zones
starts with
finds the resource name that start with the word(s) or numbers you type in the blank text field
DB Instance Class starts with db.m5: finds all resources that start with db.m5
does not starts with
selects resources that do not start with the keywords you type in the blank text field
DB Instance Class does not start with db.m5: finds all resources that do not start with db.m5
is empty
finds resources that do not have a value for the selected filter
Engine is empty set to true: finds all resources that do not have a value in for engine
is not empty
finds resources that do have a value for the selected filter
Engine is not empty set to true: finds all resources that do have a value in for engine
In the blank text field, type the word(s) or number(s) that you want your function to take action on.
Keep in mind:
Many of the filter types provide suggestions as you type.
If you select equal to, your report will return results that are an exact match of what you typed in the text field.
If you select contains, you can type as many or as few characters as you want.
Filters is less than and is greater than require a number.
Click Apply.
If applicable, select the Match All Filters check box.
Enabled by default, Match All Filters only returns results that match all selected filter options. If you do not select it, the report will contain results with any selected filter option. For example, a company is running a Windows
EC2 instance configured with two filter options:
Instance Status is equal to Stopped
Instance Platform is equal to Windows
If you selected Match All Filters, CloudCheckr will not return this EC2 instance because it does not match the Instance Status is equal to Stopped filter.
If you did not select Match All Filters, CloudCheckr will return this EC2 instance because it is an option of the Instance Platform is equal to Windows filter.
Click
(Add New Column).
A dialog box opens.
Select the columns you want to display and click Apply.
The data from all columns is also available in the custom report details. For example, if you do not select Platform as a report column, you can still find out the platform of a resource by viewing the report details.
In the Results to Show text box, type a numerical value to indicate the number of results you want CloudCheckr to generate.
If you leave Results to Show empty, the report will return all matching results.
Select your sort options.
From the first drop-down menu, select which column you want to sort by.
From the second drop-down menu, select if you want to sort the results in ascending or descending order.
From the Build Summary Chart For drop-down menu, select the parameter on which to build your report chart.
Click Save Filter.
CloudCheckr displays a notification at the top of the page after it saves the report successfully.
To access a saved custom report:
From the left navigation pane, choose Inventory > Custom Reports.
Click a sub-menu. The names of the custom reports for the selected service will display.
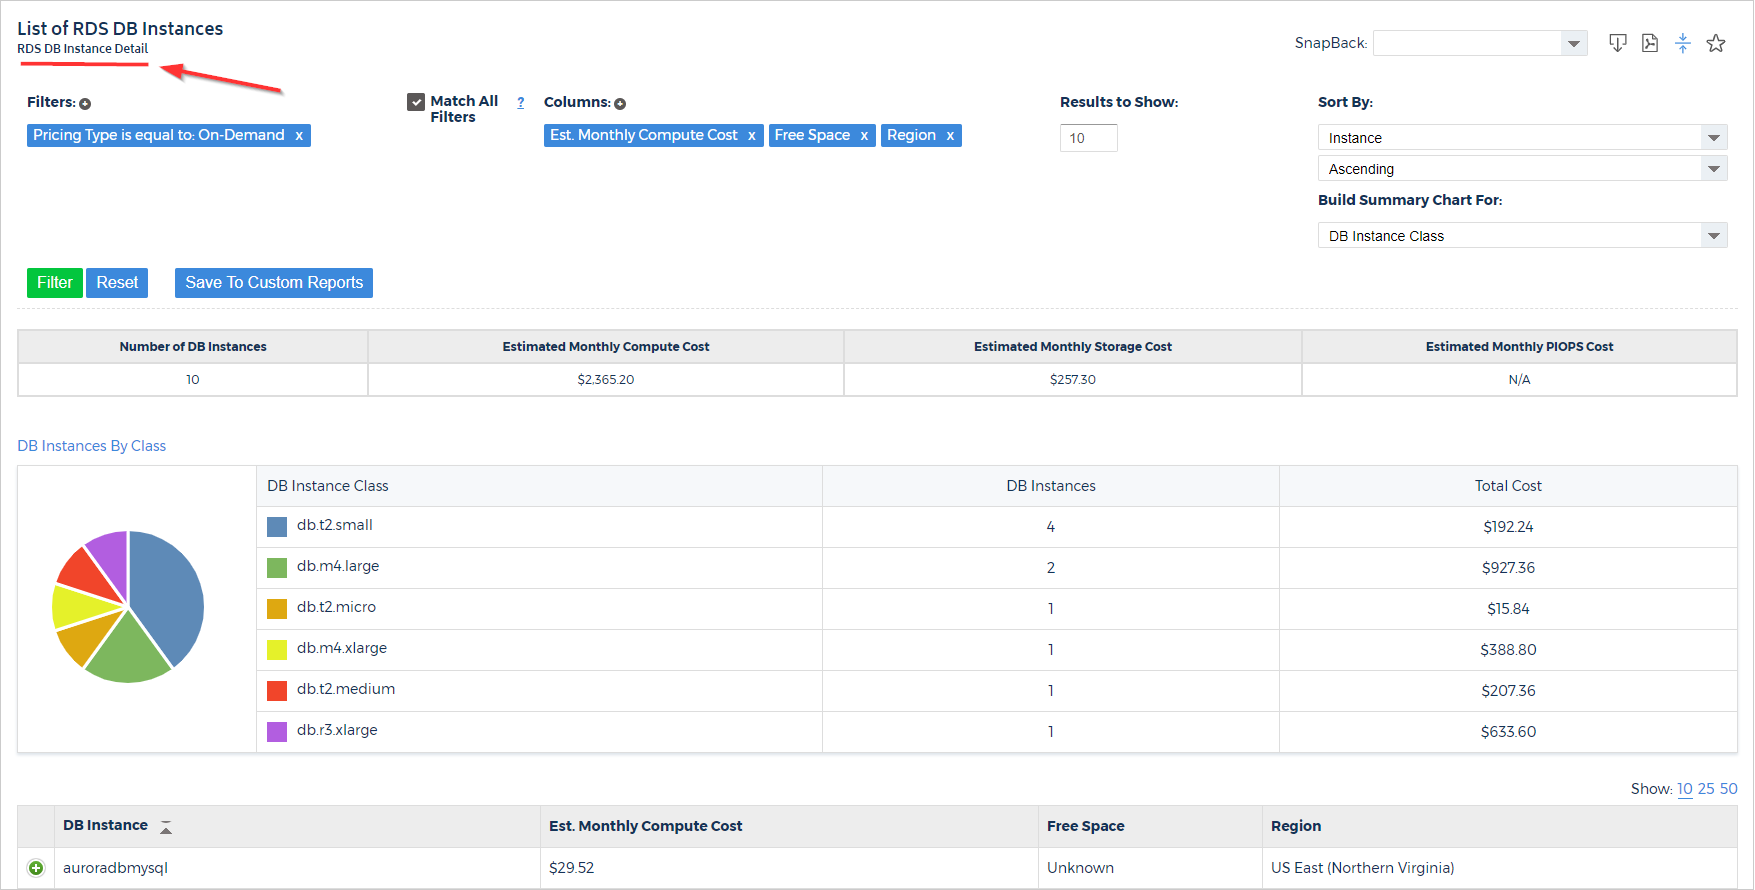
Click a report name.
CloudCheckr will display the selected custom report. The report name is located on the top left side of the screen.
Once the report is loaded, you can save the report as a CSV, download the report as a PDF, email the report, modify the filter, or delete the filter.
Use Cases
These example uses cases show you how to use the filter options to obtain custom targeted results.
Example
Description
Filters
1
You need a report to identify all running Windows instances that cost more than $100 per month in US West (Oregon), which averaged less than 50% CPU Utilization for the past 90 days.
Status is Equal To Running
Platform is Equal To Windows
Instance Cost is Greater Than 100
Region is Equal To US West (Oregon)
90 Day Avg CPU is Less Than 50
2
You need a report that shows all S3 buckets that have more than 1 million objects and are located outside of the United States.
Objects is Greater Than 1,000,000
Region Does Not Contain US
3
You need a report to show non-Linux m1.xlarge Reserved Instances running in the following availability zone: us-east-1b.
Pricing Type is Equal To Reserved
Platform is not Equal to Linux
Platform is not Equal to Linux
Type (Size) is Equal to m1.xlarge
Availability Zone is Equal to us-east-1b
4
You need a report to show all instances within a specific VPC that cost less than $200 with CPU that never spiked above 50%.
 (Add new filter).
 CloudCheckr will display the selected custom report. The report name is located on the top left side of the screen.